posted 09.07 a.m. est
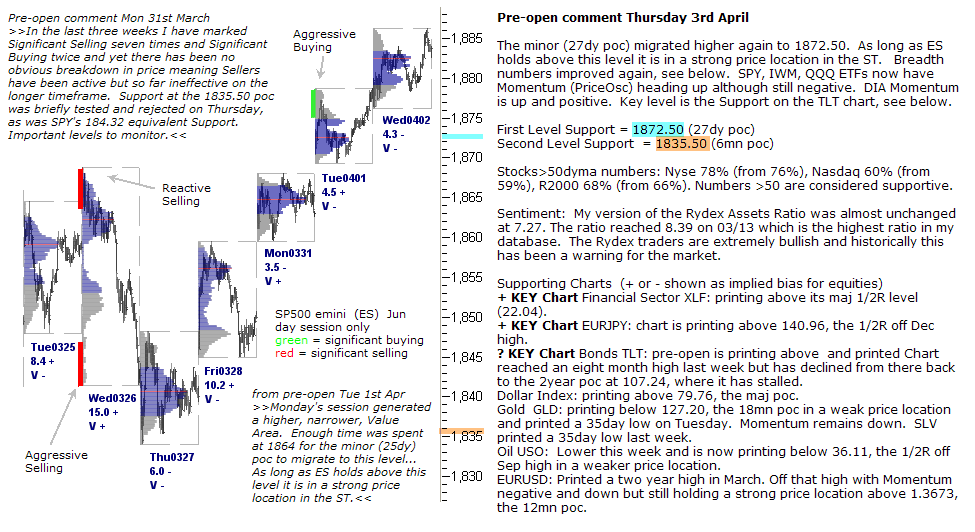
Pre-open comment Thursday 3rd April
The minor (27dy poc) migrated higher again to 1872.50. As long as ES holds above this level it is in a strong price location in the ST. Breadth numbers improved again, see below. SPY, IWM, QQQ ETFs now have Momentum (PriceOsc) heading up although still negative. DIA Momentum is up and positive. Key level is the Support on the TLT chart, see below.
First Level Support = 1872.50 (27dy poc)
Second Level Support = 1835.50 (6mn poc)
Stocks>50dyma numbers: Nyse 78% (from 76%), Nasdaq 60% (from 59%), R2000 68% (from 66%). Numbers >50 are considered supportive.
Sentiment: My version of the Rydex Assets Ratio was almost unchanged at 7.27. The ratio reached 8.39 on 03/13 which is the highest ratio in my database. The Rydex traders are extremely bullish and historically this has been a warning for the market.
Supporting Charts (+ or – shown as implied bias for equities)
+ KEY Chart Financial Sector XLF: printing above its maj 1/2R level (22.04).
+ KEY Chart EURJPY: chart is printing above 140.96, the 1/2R off Dec high.
? KEY Chart Bonds TLT: pre-open is printing above and printed Chart reached an eight month high last week but has declined from there back to the 2year poc at 107.24, where it has stalled.
Dollar Index: printing above 79.76, the maj poc.
Gold GLD: printing below 127.20, the 18mn poc in a weak price location and printed a 35day low on Tuesday. Momentum remains down. SLV printed a 35day low last week.
Oil USO: Lower this week and is now printing below 36.11, the 1/2R off Sep high in a weaker price location.
EURUSD: Printed a two year high in March. Off that high with Momentum negative and down but still holding a strong price location above 1.3673, the 12mn poc.