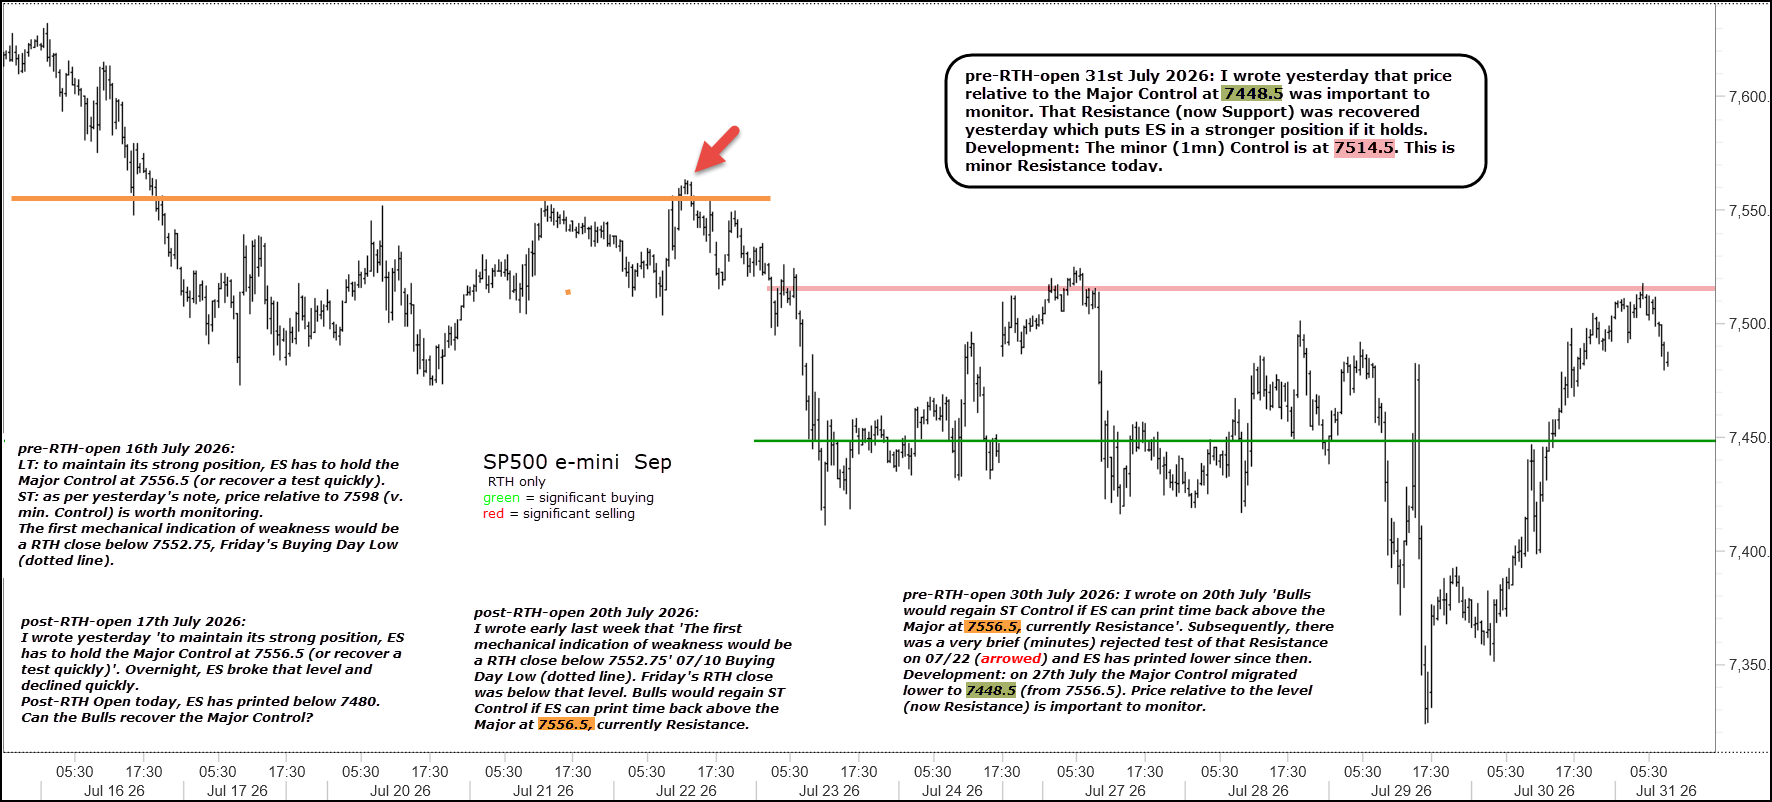
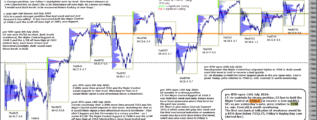
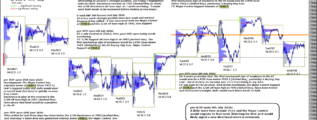
I wrote yesterday that price relative to the Major Control at 7448.5 was important to monitor. That Resistance (now Support) was recovered yesterday which puts ES in a stronger position if it holds.
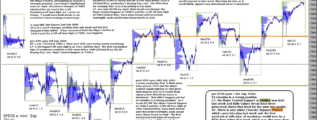
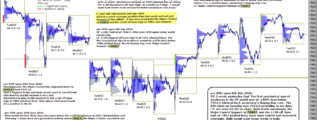
Development: The minor (1mn) Control is at 7514.5. This is minor Resistance today.