S&P 500 emini pre-open Wednesday 17th September
posted at 09.22 a.m. est
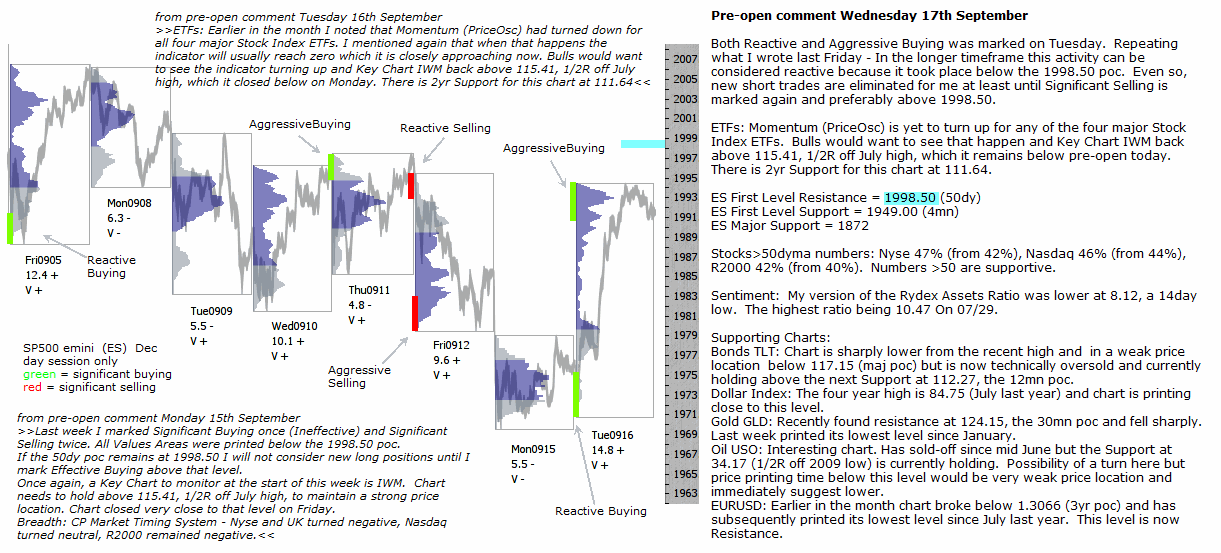
Both Reactive and Aggressive Buying was marked on Tuesday. Repeating what I wrote last Friday – In the longer timeframe this activity can be considered reactive because it took place below the 1998.50 poc. Even so, new short trades are eliminated for me at least until Significant Selling is marked again and preferably above 1998.50.
ETFs: Momentum (PriceOsc) is yet to turn up for any of the four major Stock Index ETFs. Bulls would want to see that happen and Key Chart IWM back above 115.41, 1/2R off July high, which it remains below pre-open today. There is 2yr Support for this chart at 111.64.
ES First Level Resistance = 1998.50 (50dy)
ES First Level Support = 1949.00 (4mn)
ES Major Support = 1872
Stocks>50dyma numbers: Nyse 47% (from 42%), Nasdaq 46% (from 44%), R2000 42% (from 40%). Numbers >50 are supportive.
Sentiment: My version of the Rydex Assets Ratio was lower at 8.12, a 14day low. The highest ratio being 10.47 On 07/29.
Supporting Charts:
Bonds TLT: Chart is sharply lower from the recent high and in a weak price location below 117.15 (maj poc) but is now technically oversold and currently holding above the next Support at 112.27, the 12mn poc.
Dollar Index: The four year high is 84.75 (July last year) and chart is printing close to this level.
Gold GLD: Recently found resistance at 124.15, the 30mn poc and fell sharply. Last week printed its lowest level since January.
Oil USO: Interesting chart. Has sold-off since mid June but the Support at 34.17 (1/2R off 2009 low) is currently holding. Possibility of a turn here but price printing time below this level would be very weak price location and immediately suggest lower.
EURUSD: Earlier in the month chart broke below 1.3066 (3yr poc) and has subsequently printed its lowest level since July last year. This level is now Resistance.