S&P 500 emini pre-open Thursday 25th September
posted 09.27 a.m. est
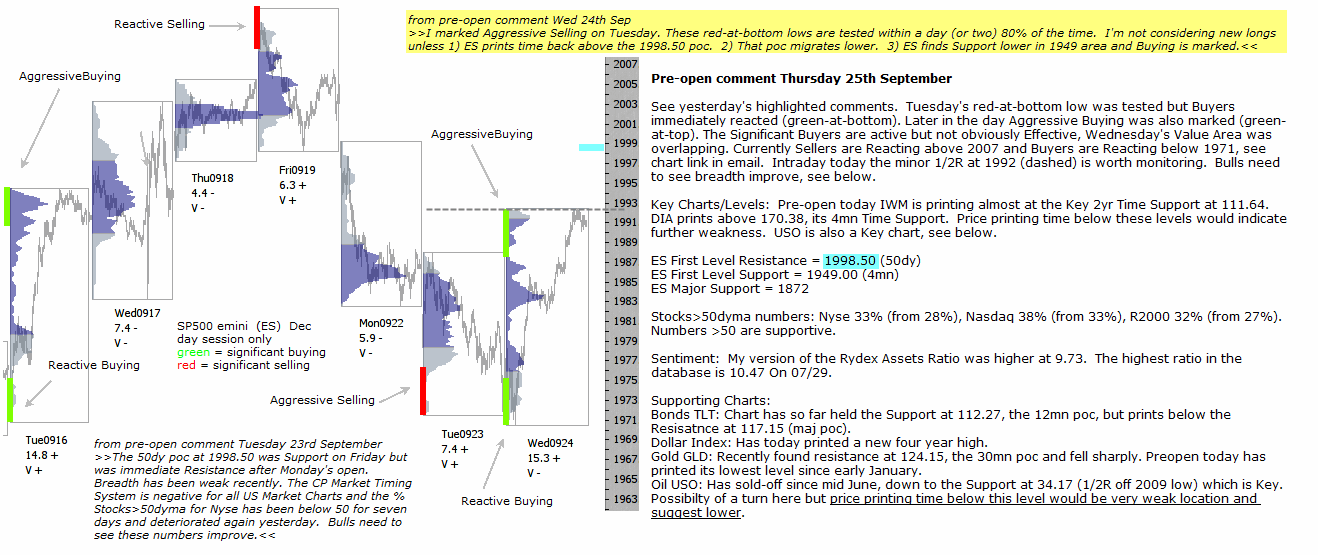
See yesterday’s highlighted comments. Tuesday’s red-at-bottom low was tested but Buyers immediately reacted (green-at-bottom). Later in the day Aggressive Buying was also marked (green-at-top). The Significant Buyers are active but not obviously Effective, Wednesday’s Value Area was overlapping. Currently Sellers are Reacting above 2007 and Buyers are Reacting below 1971, see chart link in email. Intraday today the minor 1/2R at 1992 (dashed) is worth monitoring. Bulls need to see breadth improve, see below.
Key Charts/Levels: Pre-open today IWM is printing almost at the Key 2yr Time Support at 111.64. DIA prints above 170.38, its 4mn Time Support. Price printing time below these levels would indicate further weakness. USO is also a Key chart, see below.
ES First Level Resistance = 1998.50 (50dy)
ES First Level Support = 1949.00 (4mn)
ES Major Support = 1872
Stocks>50dyma numbers: Nyse 33% (from 28%), Nasdaq 38% (from 33%), R2000 32% (from 27%). Numbers >50 are supportive.
Sentiment: My version of the Rydex Assets Ratio was higher at 9.73. The highest ratio in the database is 10.47 On 07/29.
Supporting Charts:
Bonds TLT: Chart has so far held the Support at 112.27, the 12mn poc, but prints below the Resisatnce at 117.15 (maj poc).
Dollar Index: Has today printed a new four year high.
Gold GLD: Recently found resistance at 124.15, the 30mn poc and fell sharply. Preopen today has printed its lowest level since early January.
Oil USO: Has sold-off since mid June, down to the Support at 34.17 (1/2R off 2009 low) which is Key. Possibilty of a turn here but price printing time below this level would be very weak location and suggest lower.
EURUSD: Earlier in the month chart broke below 1.3066 (3yr poc) and has today printed its lowest level since November 2012. 1.3066 is now Resistance.