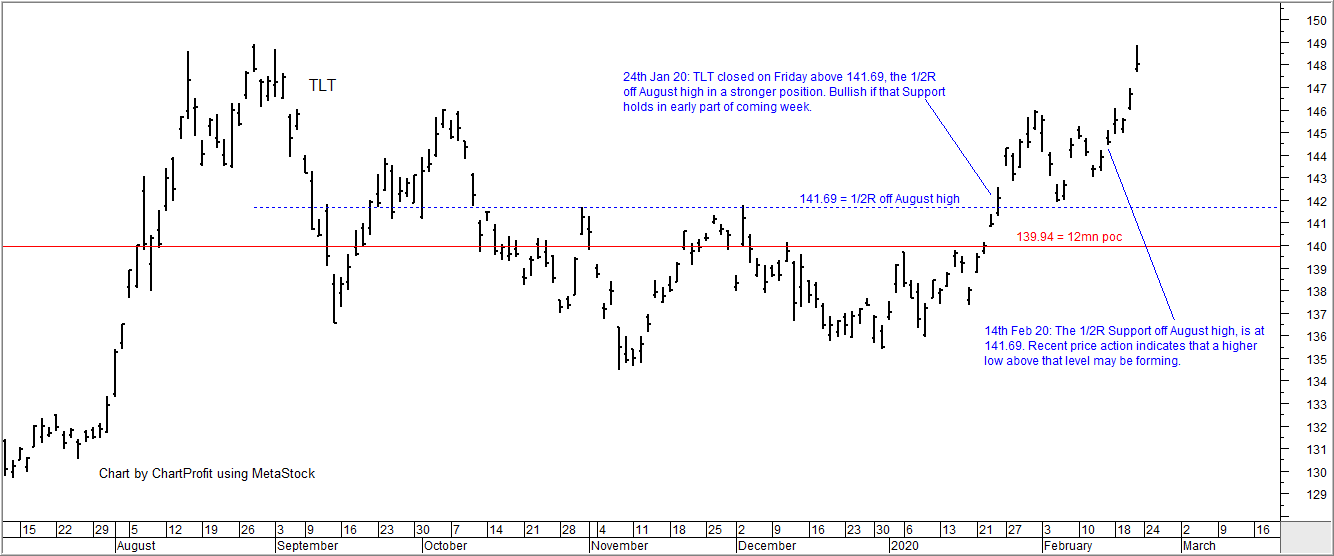
from 14th Feb 20: “The 1/2R Support off August high, is at 141.69. Recent price action indicates that a higher low above that level may be forming“. Chart updated.
Daily analysis - Stock Market, Bonds, Forex and more
from 14th Feb 20: “The 1/2R Support off August high, is at 141.69. Recent price action indicates that a higher low above that level may be forming“. Chart updated.