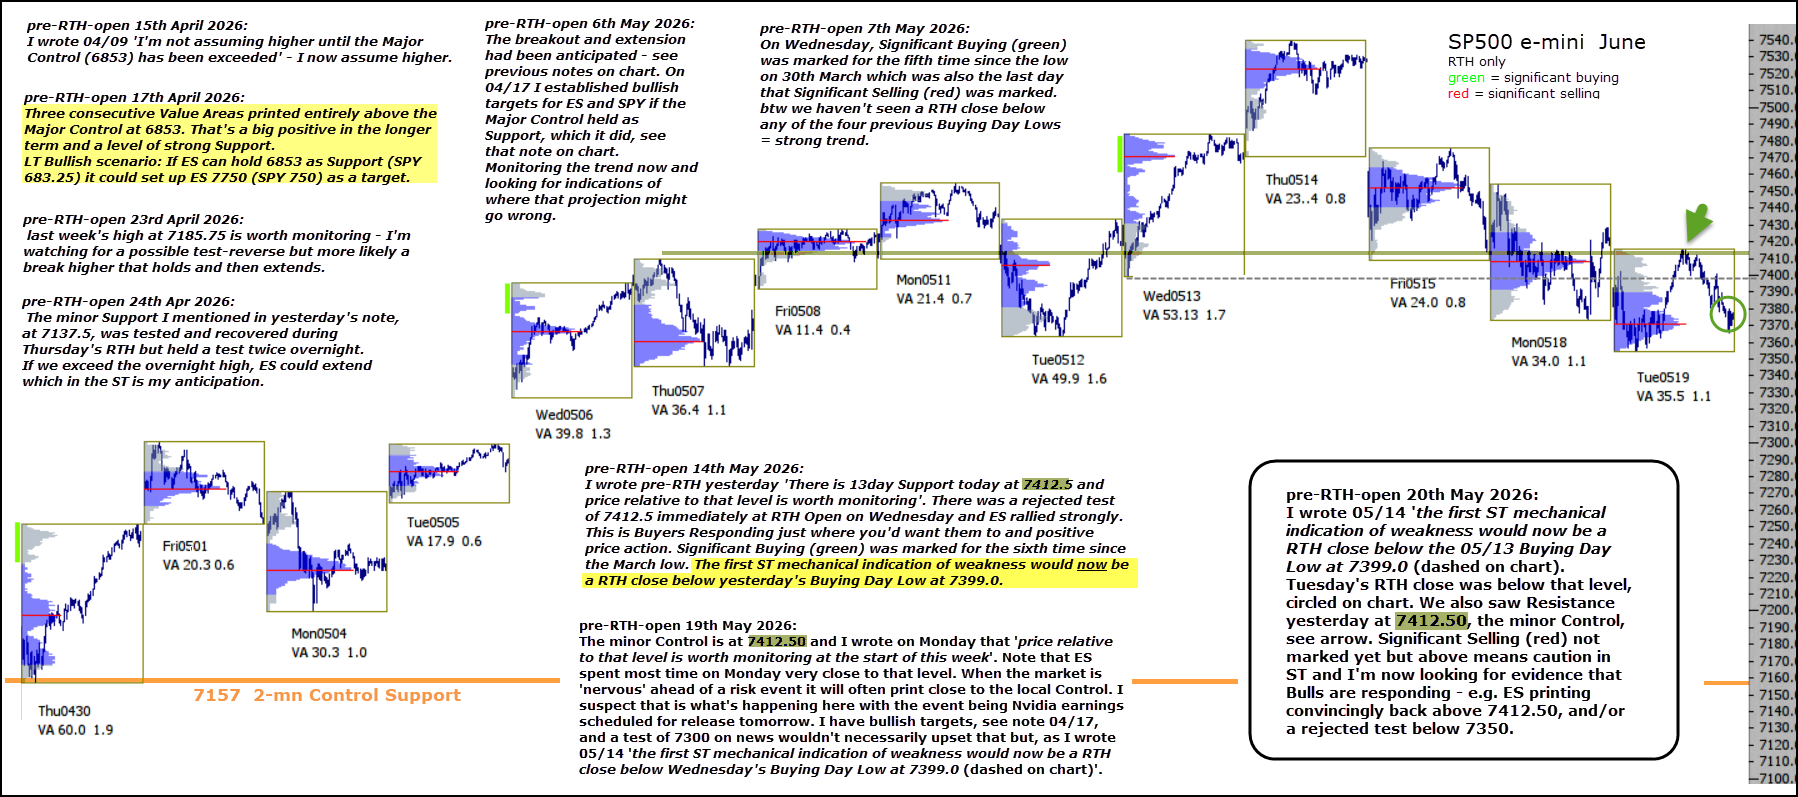
I wrote 05/14 ‘the first ST mechanical indication of weakness would now be a RTH close below the 05/13 Buying Day Low at 7399.0‘ (dashed on chart). Tuesday’s RTH close was below that level, circled on chart.
We also saw Resistance yesterday at 7412.50, the minor Control, see arrow on chart.
Significant Selling (red) has not been marked yet but the above means caution in ST and I’m now looking for evidence that Bulls are responding – e.g. ES printing convincingly back above 7412.50, and/or a rejected test below 7350.