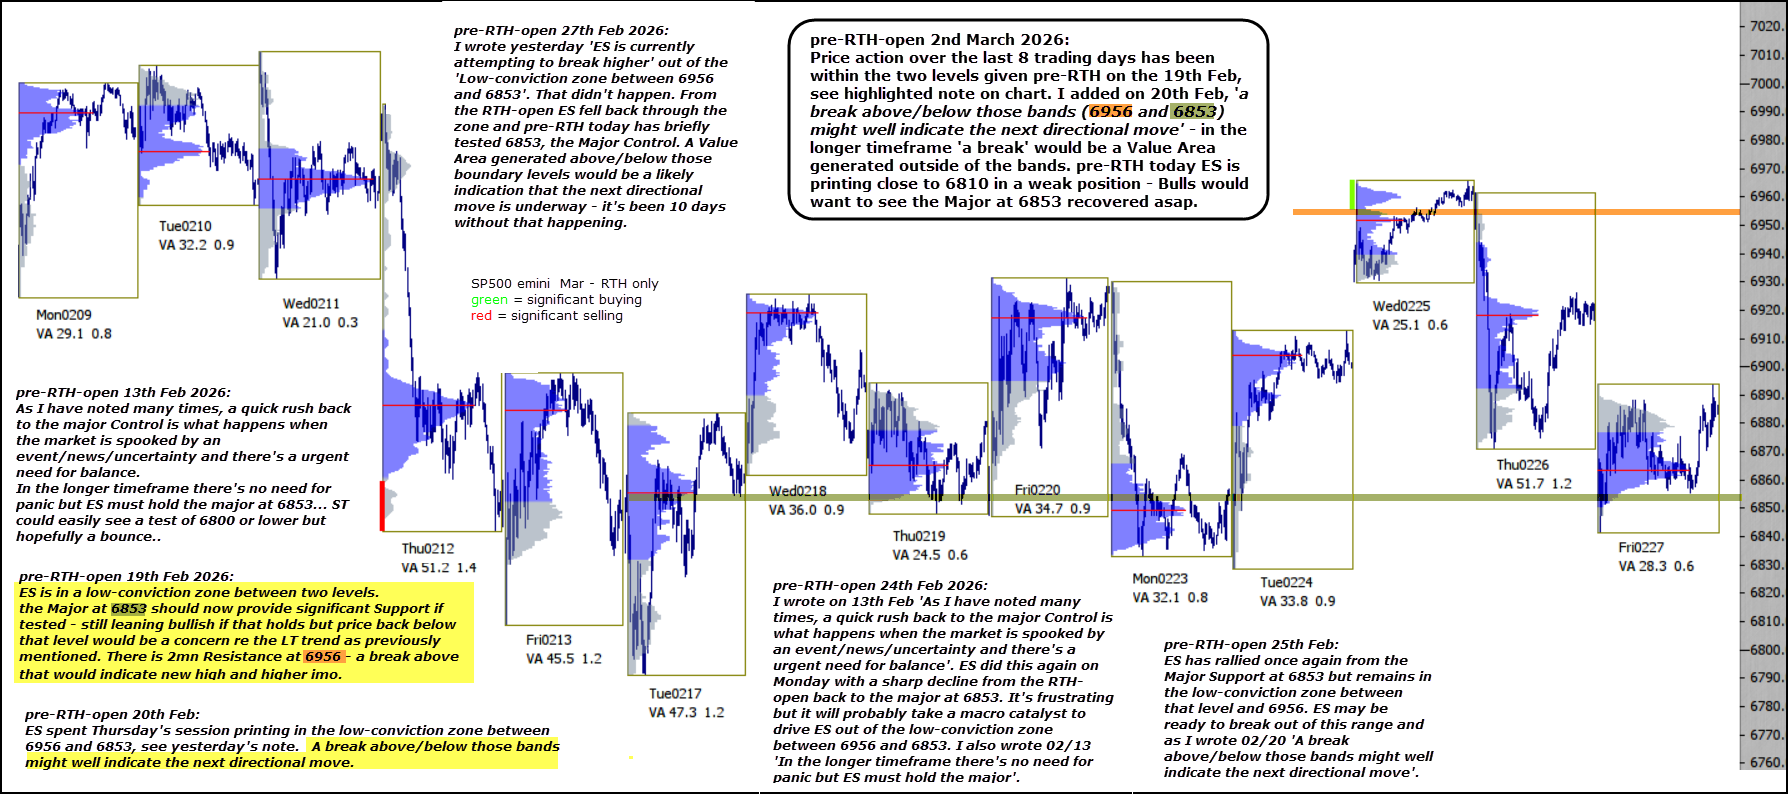
Price action over the last 8 trading days has been within the two levels given pre-RTH on 19th Feb, see highlighted note on chart. I added on 20th Feb, ‘a break above/below those bands (6956 and 6853) might well indicate the next directional move‘ – in the longer timeframe ‘a break’ would be a Value Area generated outside of the bands.
read this post on Substack
Pre-RTH today ES is printing close to 6810 in a weak position – Bulls would want to see the Major at 6853 recovered asap.