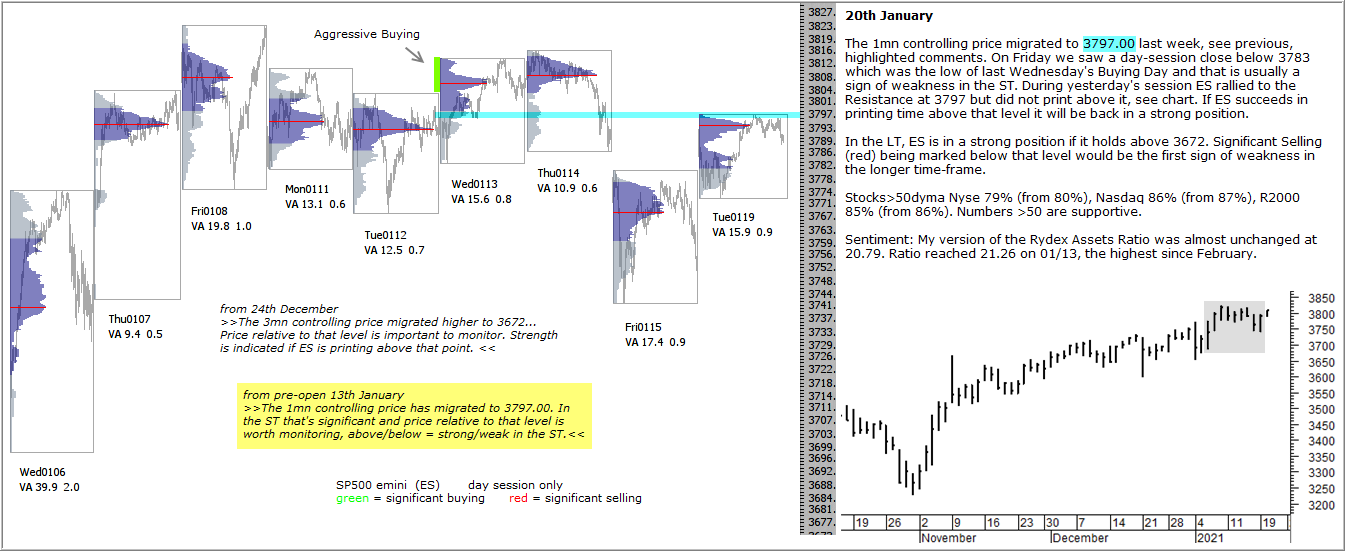
The 1mn controlling price migrated to 3797.00 last week, see previous, highlighted comments. On Friday we saw a day-session close below 3783 which was the low of last Wednesday’s Buying Day and that is usually a sign of weakness in the ST. During yesterday’s session ES rallied to the Resistance at 3797 but did not print above it, see chart. If ES succeeds in printing time above that level it will be back in a strong position.
In the LT, ES is in a strong position if it holds above 3672. Significant Selling (red) being marked below that level would be the first sign of weakness in the longer time-frame.
Stocks>50dyma Nyse 79% (from 80%), Nasdaq 86% (from 87%), R2000 85% (from 86%). Numbers >50 are supportive.
Sentiment: My version of the Rydex Assets Ratio was almost unchanged at 20.79. Ratio reached 21.26 on 01/13, the highest since February.