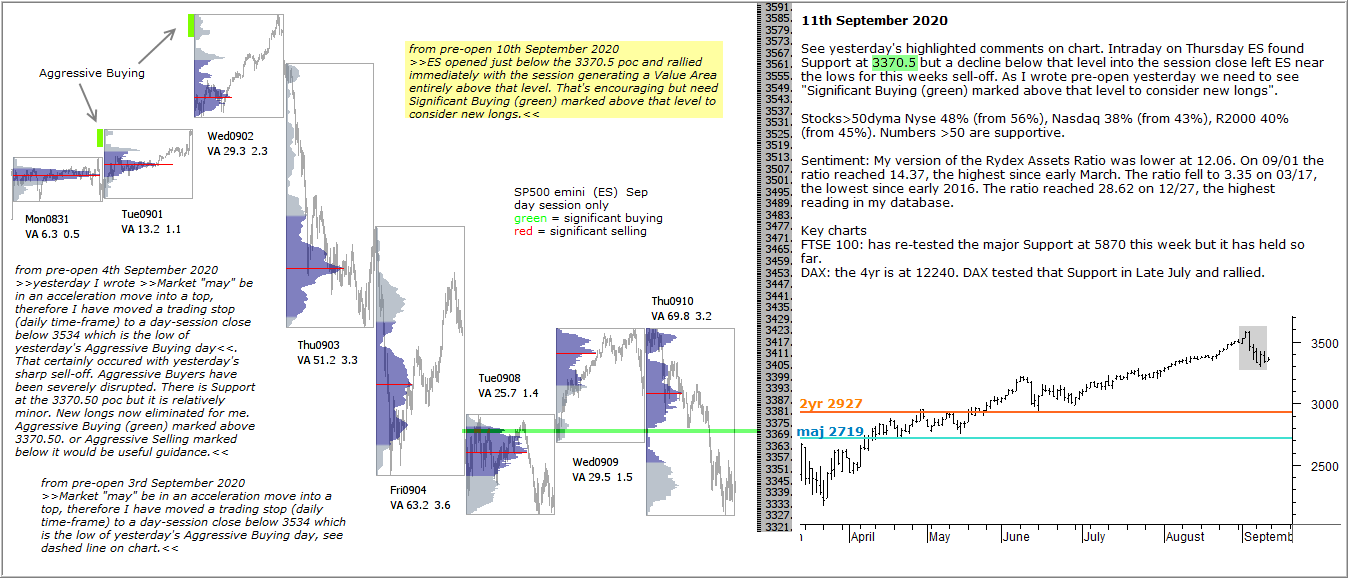
See yesterday’s highlighted comments on chart. Intraday on Thursday ES found Support at 3370.5 but a decline below that level into the session close left ES near the lows for this weeks sell-off. As I wrote pre-open yesterday we need to see “Significant Buying (green) marked above that level to consider new longs”.
Stocks>50dyma Nyse 48% (from 56%), Nasdaq 38% (from 43%), R2000 40% (from 45%). Numbers >50 are supportive.
Sentiment: My version of the Rydex Assets Ratio was lower at 12.06. On 09/01 the ratio reached 14.37, the highest since early March. The ratio fell to 3.35 on 03/17, the lowest since early 2016. The ratio reached 28.62 on 12/27, the highest reading in my database.
Key charts
FTSE 100: has re-tested the major Support at 5870 this week but it has held so far.
DAX: the 4yr is at 12240. DAX tested that Support in Late July and rallied.