emini 12th May 2020 – pre-open from ChartProfit
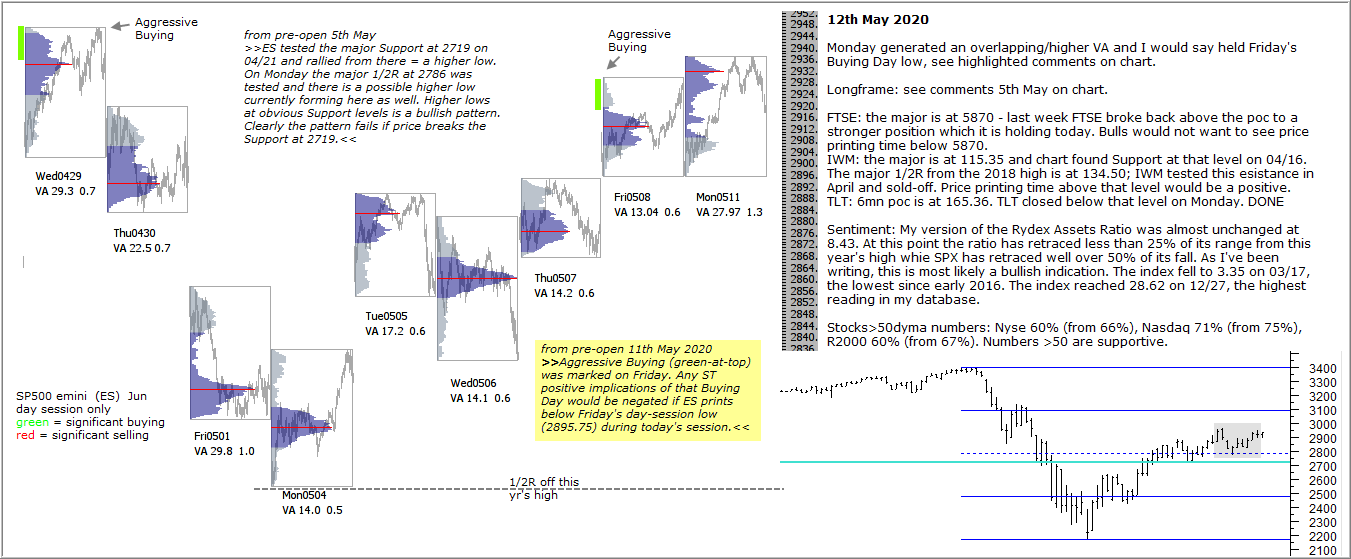
Monday generated an overlapping/higher VA and I would say held Friday’s Buying Day low, see highlighted comments on chart.
Longframe: see comments 5th May on chart.
FTSE: the major is at 5870 – last week FTSE broke back above the poc to a stronger position which it is holding today. Bulls would not want to see price printing time below 5870.
IWM: the major is at 115.35 and chart found Support at that level on 04/16. The major 1/2R from the 2018 high is at 134.50; IWM tested this esistance in April and sold-off. Price printing time above that level would be a positive.
TLT: 6mn poc is at 165.36. TLT closed below that level on Monday. DONE
Sentiment: My version of the Rydex Assets Ratio was almost unchanged at 8.43. At this point the ratio has retraced less than 25% of its range from this year’s high whie SPX has retraced well over 50% of its fall. As I’ve been writing, this is most likely a bullish indication. The index fell to 3.35 on 03/17, the lowest since early 2016. The index reached 28.62 on 12/27, the highest reading in my database.
Stocks>50dyma numbers: Nyse 60% (from 66%), Nasdaq 71% (from 75%), R2000 60% (from 67%). Numbers >50 are supportive.