emini 1st May 2020
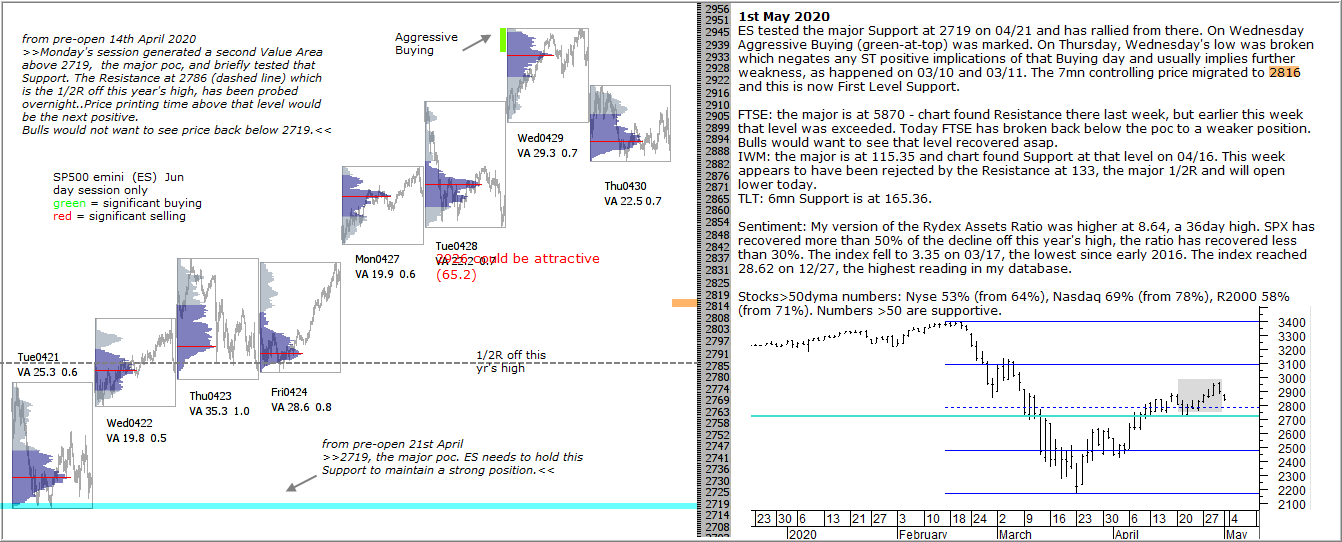
ES tested the major Support at 2719 on 04/21 and has rallied from there. On Wednesday Aggressive Buying (green-at-top) was marked. On Thursday, Wednesday’s low was broken which negates any ST positive implications of that Buying day and usually implies further weakness, as happened on 03/10 and 03/11. The 7mn controlling price migrated to 2816 and this is now First Level Support.
FTSE: the major is at 5870 – chart found Resistance there last week, but earlier this week that level was exceeded. Today FTSE has broken back below the poc to a weaker position. Bulls would want to see that level recovered asap.
IWM: the major is at 115.35 and chart found Support at that level on 04/16. This week appears to have been rejected by the Resistance at 133, the major 1/2R and will open lower today.
TLT: 6mn Support is at 165.36.
Sentiment: My version of the Rydex Assets Ratio was higher at 8.64, a 36day high. SPX has recovered more than 50% of the decline off this year’s high, the ratio has recovered less than 30%. The index fell to 3.35 on 03/17, the lowest since early 2016. The index reached 28.62 on 12/27, the highest reading in my database.
Stocks>50dyma numbers: Nyse 53% (from 64%), Nasdaq 69% (from 78%), R2000 58% (from 71%). Numbers >50 are supportive.