emini 30th March 2020 from ChartProfit
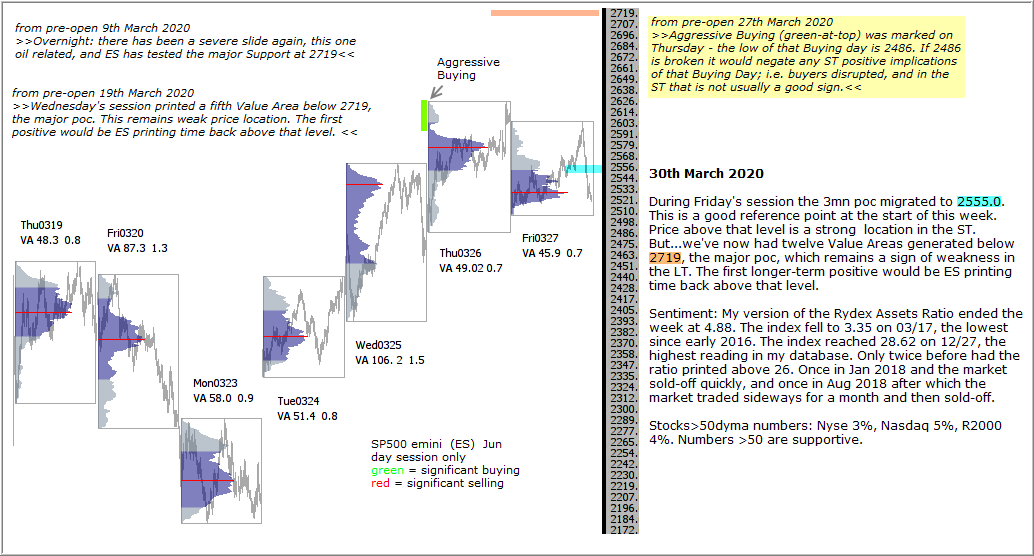
During Friday’s session the 3mn poc migrated to 2555.0. This is a good reference point at the start of this week. Price above that level is a strong location in the ST. But…we’ve now had twelve Value Areas generated below 2719, the major poc, which remains a sign of weakness in the LT. The first longer-term positive would be ES printing time back above that level.
Sentiment: My version of the Rydex Assets Ratio ended the week at 4.88. The index fell to 3.35 on 03/17, the lowest since early 2016. The index reached 28.62 on 12/27, the highest reading in my database. Only twice before had the ratio printed above 26. Once in Jan 2018 and the market sold-off quickly, and once in Aug 2018 after which the market traded sideways for a month and then sold-off.
Stocks>50dyma numbers: Nyse 3%, Nasdaq 5%, R2000 4%. Numbers >50 are supportive.