emini ES 5th May 2020 from ChartProfit
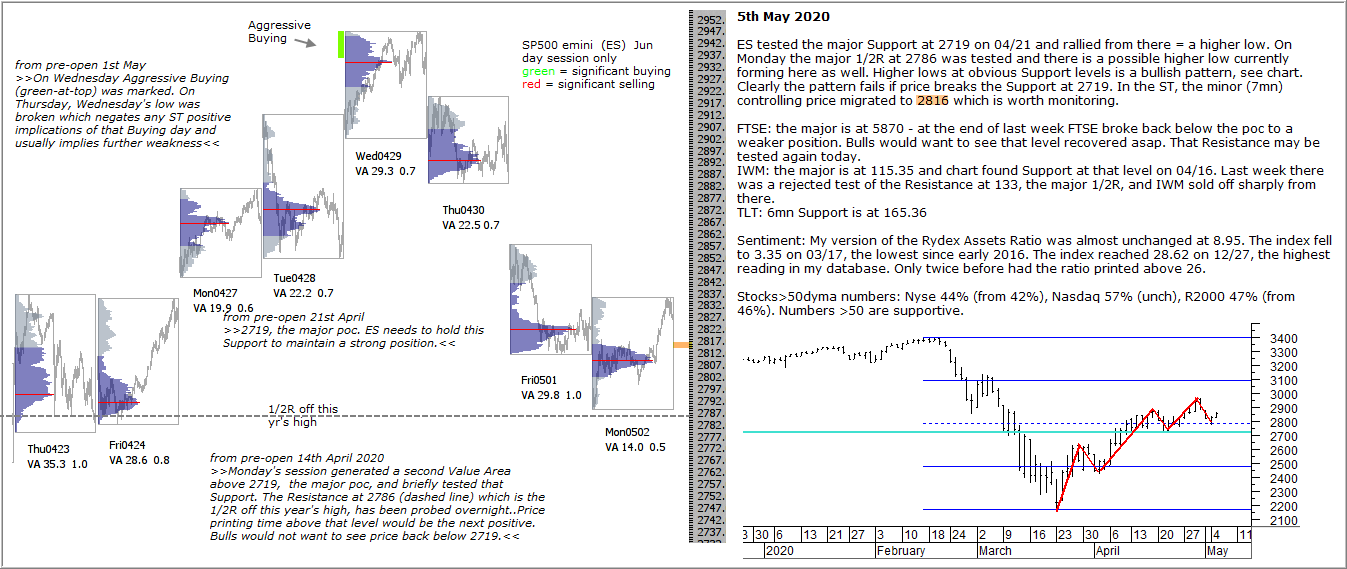
ES tested the major Support at 2719 on 04/21 and rallied from there = a higher low. On Monday the major 1/2R at 2786 was tested and there is a possible higher low currently forming here as well. Higher lows at obvious Support levels is a bullish pattern, see chart. Clearly the pattern fails if price breaks the Support at 2719. In the ST, the minor (7mn) controlling price migrated to 2816 which is worth monitoring.
FTSE: the major is at 5870 – at the end of last week FTSE broke back below the poc to a weaker position. Bulls would want to see that level recovered asap. That Resistance may be tested again today.
IWM: the major is at 115.35 and chart found Support at that level on 04/16. Last week there was a rejected test of the Resistance at 133, the major 1/2R, and IWM sold off sharply from there.
TLT: 6mn Support is at 165.36
Sentiment: My version of the Rydex Assets Ratio was almost unchanged at 8.95. The index fell to 3.35 on 03/17, the lowest since early 2016. The index reached 28.62 on 12/27, the highest reading in my database. Only twice before had the ratio printed above 26.
Stocks>50dyma numbers: Nyse 44% (from 42%), Nasdaq 57% (unch), R2000 47% (from 46%). Numbers >50 are supportive.