emini 8th May 2020
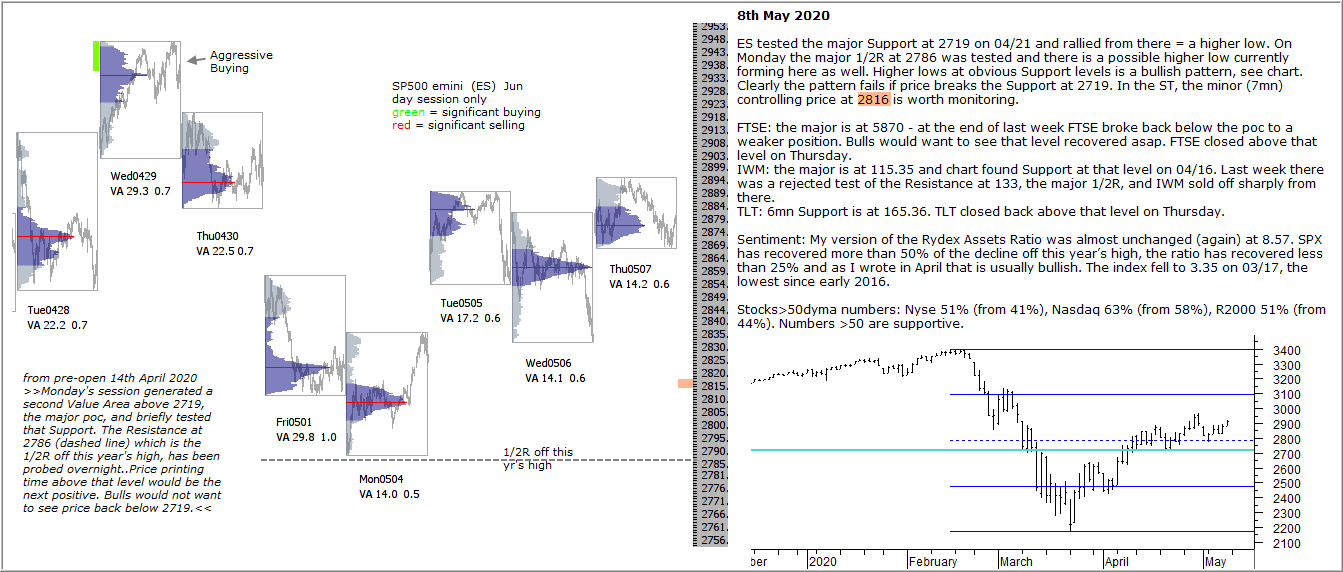
ES tested the major Support at 2719 on 04/21 and rallied from there = a higher low. On Monday the major 1/2R at 2786 was tested and there is a possible higher low currently forming here as well. Higher lows at obvious Support levels is a bullish pattern, see chart. Clearly the pattern fails if price breaks the Support at 2719. In the ST, the minor (7mn) controlling price at 2816 is worth monitoring.
FTSE: the major is at 5870 – at the end of last week FTSE broke back below the poc to a weaker position. Bulls would want to see that level recovered asap. FTSE closed above that level on Thursday.
IWM: the major is at 115.35 and chart found Support at that level on 04/16. Last week there was a rejected test of the Resistance at 133, the major 1/2R, and IWM sold off sharply from there.
TLT: 6mn Support is at 165.36. TLT closed back above that level on Thursday.
Sentiment: My version of the Rydex Assets Ratio was almost unchanged (again) at 8.57. SPX has recovered more than 50% of the decline off this year’s high, the ratio has recovered less than 25% and as I wrote in April that is usually bullish. The index fell to 3.35 on 03/17, the lowest since early 2016.
Stocks>50dyma numbers: Nyse 51% (from 41%), Nasdaq 63% (from 58%), R2000 51% (from 44%). Numbers >50 are supportive.