Chartprofit pre-open emini analysis Wednesday 20th July
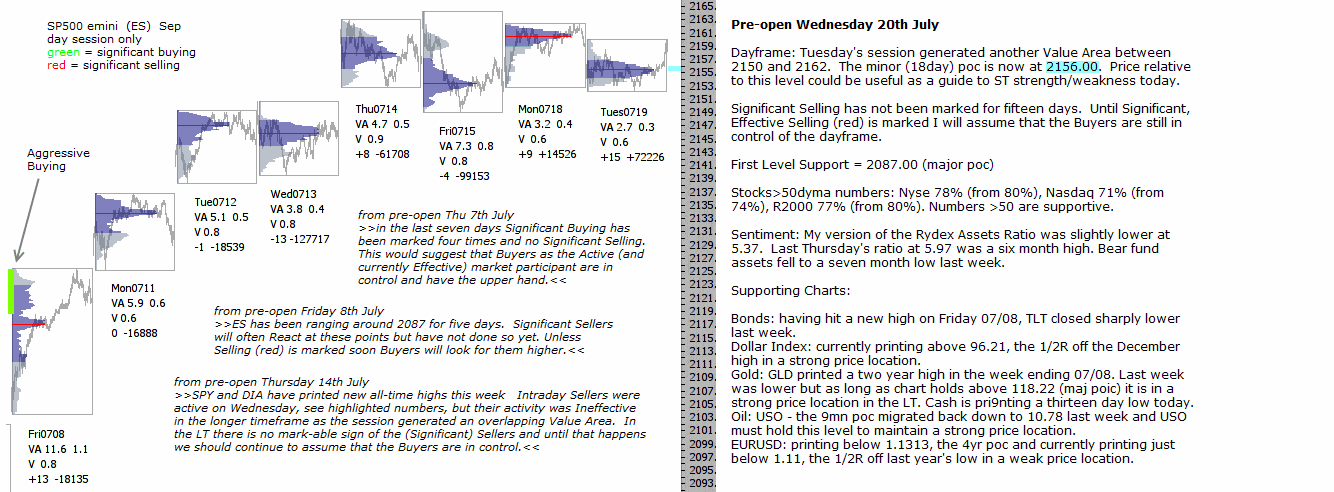
Dayframe: Tuesday’s session generated another Value Area between 2150 and 2162. The minor (18day) poc is now at 2156.00. Price relative to this level could be useful as a guide to ST strength/weakness today.
Significant Selling has not been marked for fifteen days. Until Significant, Effective Selling (red) is marked I will assume that the Buyers are still in control of the dayframe.
First Level Support = 2087.00 (major poc)
Stocks>50dyma numbers: Nyse 78% (from 80%), Nasdaq 71% (from 74%), R2000 77% (from 80%). Numbers >50 are supportive.
Sentiment: My version of the Rydex Assets Ratio was slightly lower at 5.37. Last Thursday’s ratio at 5.97 was a six month high. Bear fund assets fell to a seven month low last week.
Supporting Charts:
Bonds: having hit a new high on Friday 07/08, TLT closed sharply lower last week.
Dollar Index: currently printing above 96.21, the 1/2R off the December high in a strong price location.
Gold: GLD printed a two year high in the week ending 07/08. Last week was lower but as long as chart holds above 118.22 (maj poic) it is in a strong price location in the LT. Cash is pri9nting a thirteen day low today.
Oil: USO – the 9mn poc migrated back down to 10.78 last week and USO must hold this level to maintain a strong price location.
EURUSD: printing below 1.1313, the 4yr poc and currently printing just below 1.11, the 1/2R off last year’s low in a weak price location.
click to enlarge graphic