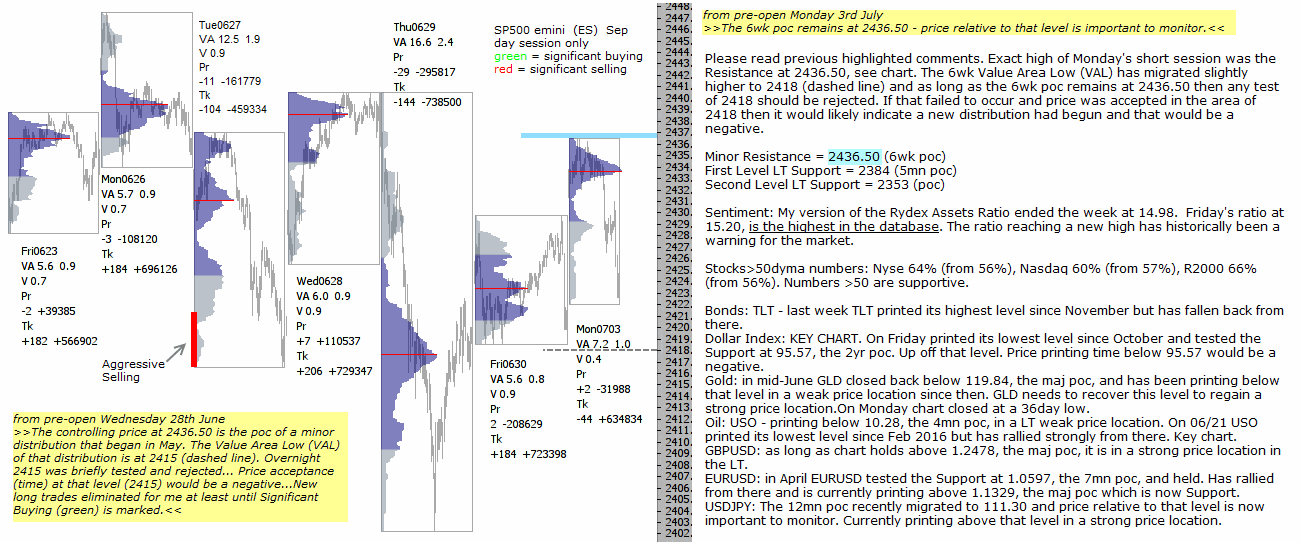
Please read previous highlighted comments. Exact high of Monday’s short session was the Resistance at 2436.50, see chart. The 6wk Value Area Low (VAL) has migrated slightly higher to 2418 (dashed line) and as long as the 6wk poc remains at 2436.50 then any test of 2418 should be rejected. If that failed to occur and price was accepted in the area of 2418 then it would likely indicate a new distribution had begun and that would be a negative.
Minor Resistance = 2436.50 (6wk poc)
First Level LT Support = 2384 (5mn poc)
Second Level LT Support = 2353 (poc)
Sentiment: My version of the Rydex Assets Ratio ended the week at 14.98. Friday’s ratio at 15.20, is the highest in the database. The ratio reaching a new high has historically been a warning for the market.
Stocks>50dyma numbers: Nyse 64% (from 56%), Nasdaq 60% (from 57%), R2000 66% (from 56%). Numbers >50 are supportive.
Bonds: TLT – last week TLT printed its highest level since November but has fallen back from there.
Dollar Index: KEY CHART. On Friday printed its lowest level since October and tested the Support at 95.57, the 2yr poc. Up off that level. Price printing time below 95.57 would be a negative.
Gold: in mid-June GLD closed back below 119.84, the maj poc, and has been printing below that level in a weak price location since then. GLD needs to recover this level to regain a strong price location.On Monday chart closed at a 36day low.
Oil: USO – printing below 10.28, the 4mn poc, in a LT weak price location. On 06/21 USO printed its lowest level since Feb 2016 but has rallied strongly from there. Key chart.
GBPUSD: as long as chart holds above 1.2478, the maj poc, it is in a strong price location in the LT.
EURUSD: in April EURUSD tested the Support at 1.0597, the 7mn poc, and held. Has rallied from there and is currently printing above 1.1329, the maj poc which is now Support.
USDJPY: The 12mn poc recently migrated to 111.30 and price relative to that level is now important to monitor. Currently printing above that level in a strong price location.
click graphic to enlarge