emini analysis 5th September 2017 – pre-open from Chartprofit
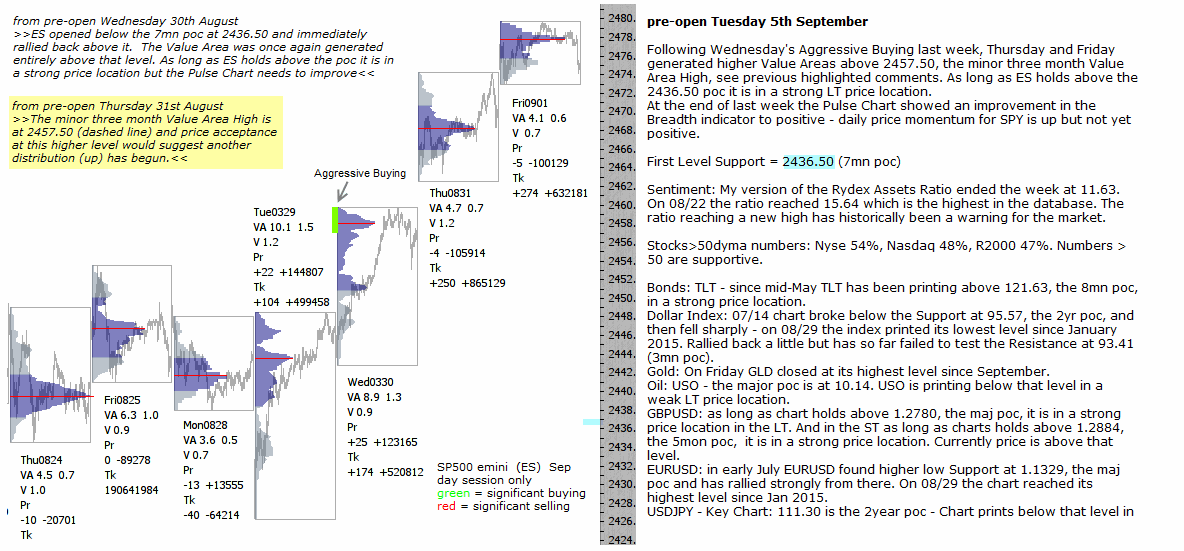
Following Wednesday’s Aggressive Buying last week, Thursday and Friday generated higher Value Areas above 2457.50, the minor three month Value Area High, see previous highlighted comments. As long as ES holds above the 2436.50 poc it is in a strong LT price location.
At the end of last week the Pulse Chart showed an improvement in the Breadth indicator to positive – daily price momentum for SPY is up but not yet positive.
First Level Support = 2436.50 (7mn poc)
Sentiment: My version of the Rydex Assets Ratio ended the week at 11.63. On 08/22 the ratio reached 15.64 which is the highest in the database. The ratio reaching a new high has historically been a warning for the market.
Stocks>50dyma numbers: Nyse 54%, Nasdaq 48%, R2000 47%. Numbers >50 are supportive.
Bonds: TLT – since mid-May TLT has been printing above 121.63, the 8mn poc, in a strong price location.
Dollar Index: 07/14 chart broke below the Support at 95.57, the 2yr poc, and then fell sharply – on 08/29 the index printed its lowest level since January 2015. Rallied back a little but has so far failed to test the Resistance at 93.41 (3mn poc).
Gold: On Friday GLD closed at its highest level since September.
Oil: USO – the major poc is at 10.14. USO is printing below that level in a weak LT price location.
GBPUSD: as long as chart holds above 1.2780, the maj poc, it is in a strong price location in the LT. And in the ST as long as charts holds above 1.2884, the 5mon poc, it is in a strong price location. Currently price is above that level.
EURUSD: in early July EURUSD found higher low Support at 1.1329, the maj poc and has rallied strongly from there. On 08/29 the chart reached its highest level since Jan 2015.
USDJPY – Key Chart: 111.30 is the 2year poc – Chart prints below that level in a weak price location. There is Support at 108.87 (1/2R off 2016 low). Price below that level would be weaker price location.
click graphic to enlarge