emini analysis 8th December 2017 – pre-open from Chartprofit
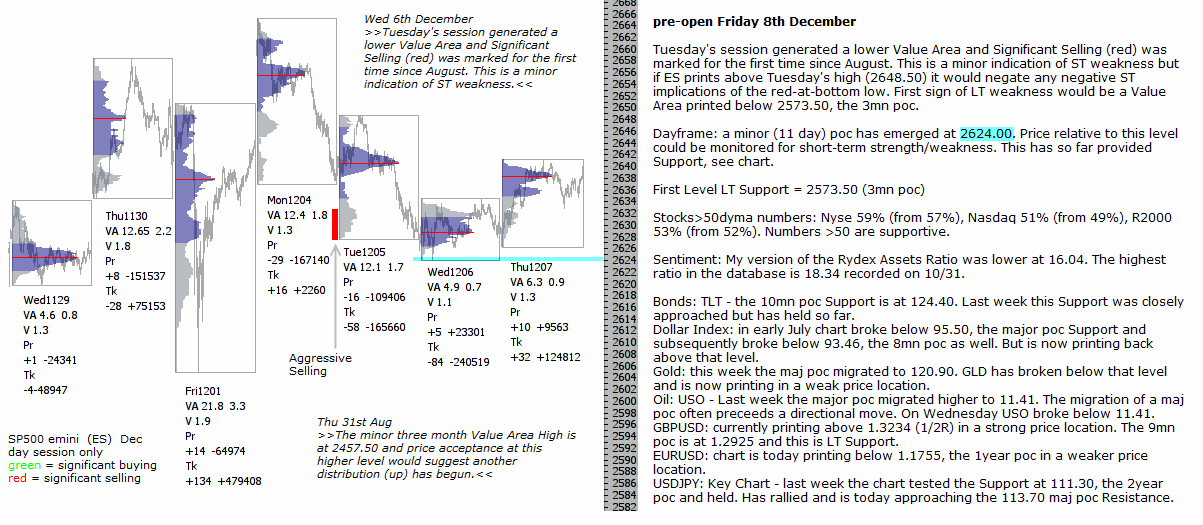
Tuesday’s session generated a lower Value Area and Significant Selling (red) was marked for the first time since August. This is a minor indication of ST weakness but if ES prints above Tuesday’s high (2648.50) it would negate any negative ST implications of the red-at-bottom low. First sign of LT weakness would be a Value Area printed below 2573.50, the 3mn poc.
Dayframe: a minor (11 day) poc has emerged at 2624.00. Price relative to this level could be monitored for short-term strength/weakness. This has so far provided Support, see chart.
First Level LT Support = 2573.50 (3mn poc)
Stocks>50dyma numbers: Nyse 59% (from 57%), Nasdaq 51% (from 49%), R2000 53% (from 52%). Numbers >50 are supportive.
Sentiment: My version of the Rydex Assets Ratio was lower at 16.04. The highest ratio in the database is 18.34 recorded on 10/31.
Bonds: TLT – the 10mn poc Support is at 124.40. Last week this Support was closely approached but has held so far.
Dollar Index: in early July chart broke below 95.50, the major poc Support and subsequently broke below 93.46, the 8mn poc as well. But is now printing back above that level.
Gold: this week the maj poc migrated to 120.90. GLD has broken below that level and is now printing in a weak price location.
Oil: USO – Last week the major poc migrated higher to 11.41. The migration of a maj poc often preceeds a directional move. On Wednesday USO broke below 11.41.
GBPUSD: currently printing above 1.3234 (1/2R) in a strong price location. The 9mn poc is at 1.2925 and this is LT Support.
EURUSD: chart is today printing below 1.1755, the 1year poc in a weaker price location.
USDJPY: Key Chart – last week the chart tested the Support at 111.30, the 2year poc and held. Has rallied and is today approaching the 113.70 maj poc Resistance.
click to enlarge graphic