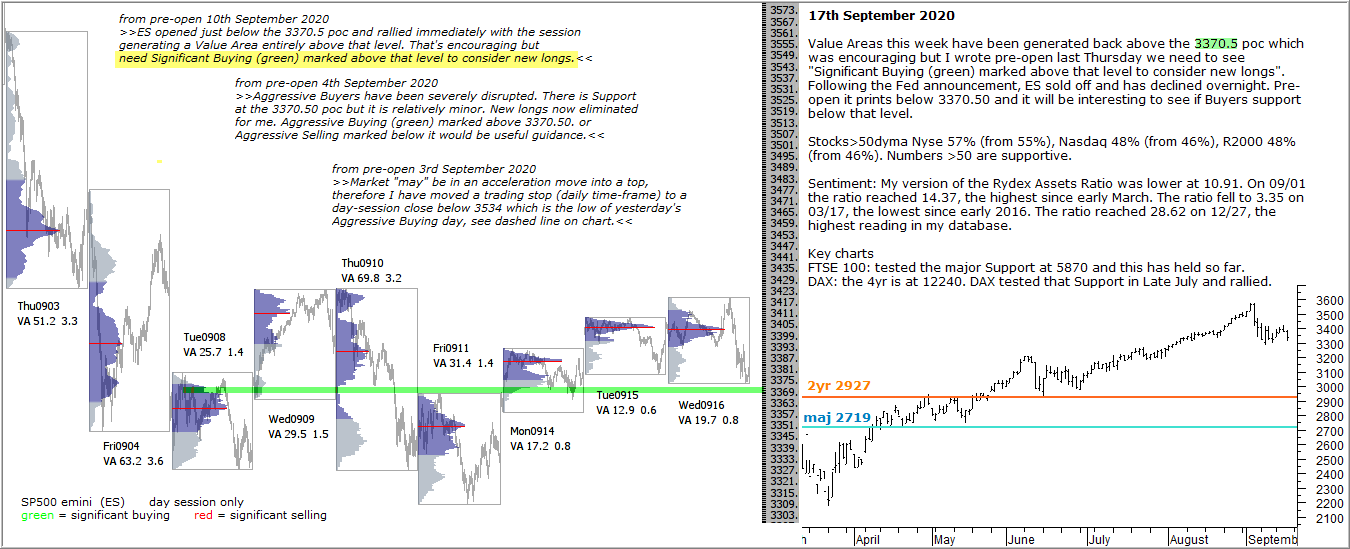
Value Areas this week have been generated back above the 3370.5 poc which was encouraging but I wrote pre-open last Thursday we need to see “Significant Buying (green) marked above that level to consider new longs”. Following the Fed announcement, ES sold off and has declined overnight. Pre-open it prints below 3370.50 and it will be interesting to see if Buyers support below that level.
Stocks>50dyma Nyse 57% (from 55%), Nasdaq 48% (from 46%), R2000 48% (from 46%). Numbers >50 are supportive.
Sentiment: My version of the Rydex Assets Ratio was lower at 10.91. On 09/01 the ratio reached 14.37, the highest since early March. The ratio fell to 3.35 on 03/17, the lowest since early 2016. The ratio reached 28.62 on 12/27, the highest reading in my database.
Key charts
FTSE 100: tested the major Support at 5870 and this has held so far.
DAX: the 4yr is at 12240. DAX tested that Support in Late July and rallied.