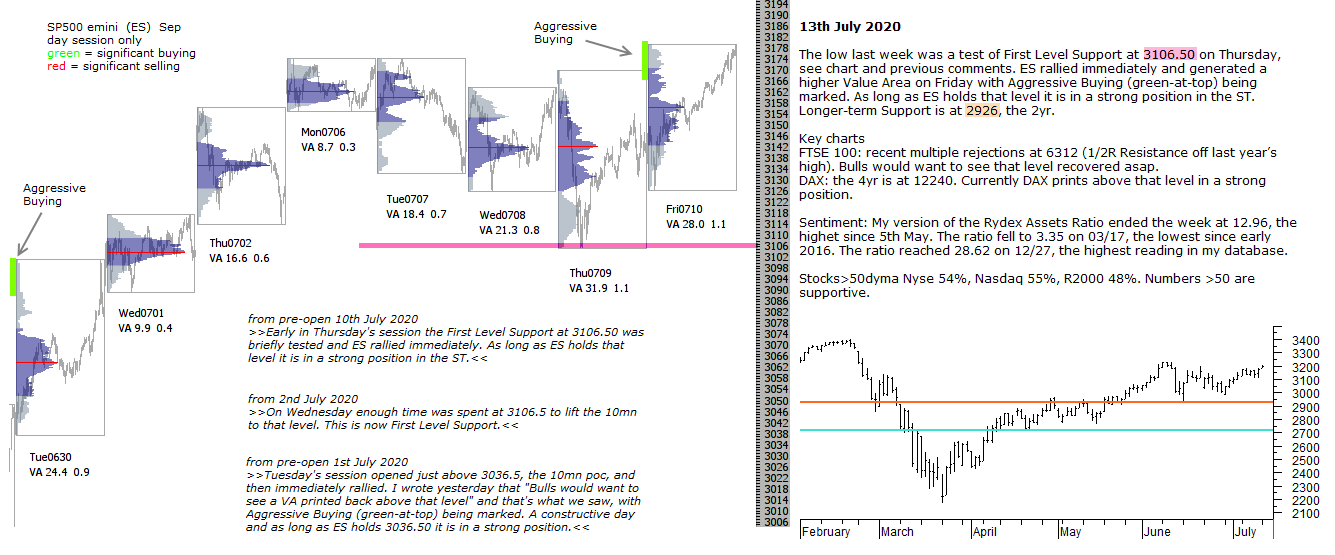
The low last week was a test of First Level Support at 3106.50 on Thursday, see chart and previous comments. ES rallied immediately and generated a higher Value Area on Friday with Aggressive Buying (green-at-top) being marked. As long as ES holds that level it is in a strong position in the ST. Longer-term Support is at 2926, the 2yr.
Key charts
FTSE 100: recent multiple rejections at 6312 (1/2R Resistance off last year’s high). Bulls would want to see that level recovered asap.
DAX: the 4yr is at 12240. Currently DAX prints above that level in a strong position.
Sentiment: My version of the Rydex Assets Ratio ended the week at 12.96, the highet since 5th May. The ratio fell to 3.35 on 03/17, the lowest since early 2016. The ratio reached 28.62 on 12/27, the highest reading in my database.
Stocks>50dyma Nyse 54%, Nasdaq 55%, R2000 48%. Numbers >50 are supportive.