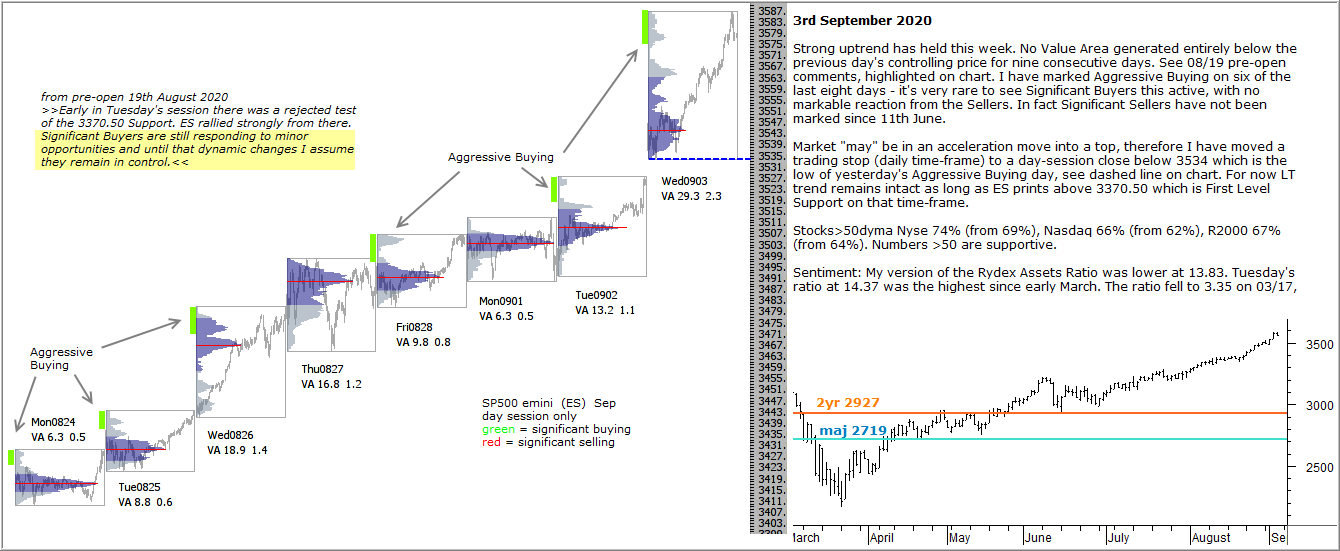
Strong uptrend has held this week. No Value Area generated entirely below the previous day’s controlling price for nine consecutive days. See 08/19 pre-open comments, highlighted on chart. I have marked Aggressive Buying on six of the last eight days – it’s very rare to see Significant Buyers this active, with no markable reaction from the Sellers. In fact Significant Sellers have not been marked since 11th June.
Market “may” be in an acceleration move into a top, therefore I have moved a trading stop (daily time-frame) to a day-session close below 3534 which is the low of yesterday’s Aggressive Buying day, see dashed line on chart. For now LT trend remains intact as long as ES prints above 3370.50 which is First Level Support on that time-frame.
Stocks>50dyma Nyse 74% (from 69%), Nasdaq 66% (from 62%), R2000 67% (from 64%). Numbers >50 are supportive.
Sentiment: My version of the Rydex Assets Ratio was lower at 13.83. Tuesday’s ratio at 14.37 was the highest since early March. The ratio fell to 3.35 on 03/17, the lowest since early 2016. The ratio reached 28.62 on 12/27, the highest reading in my database.