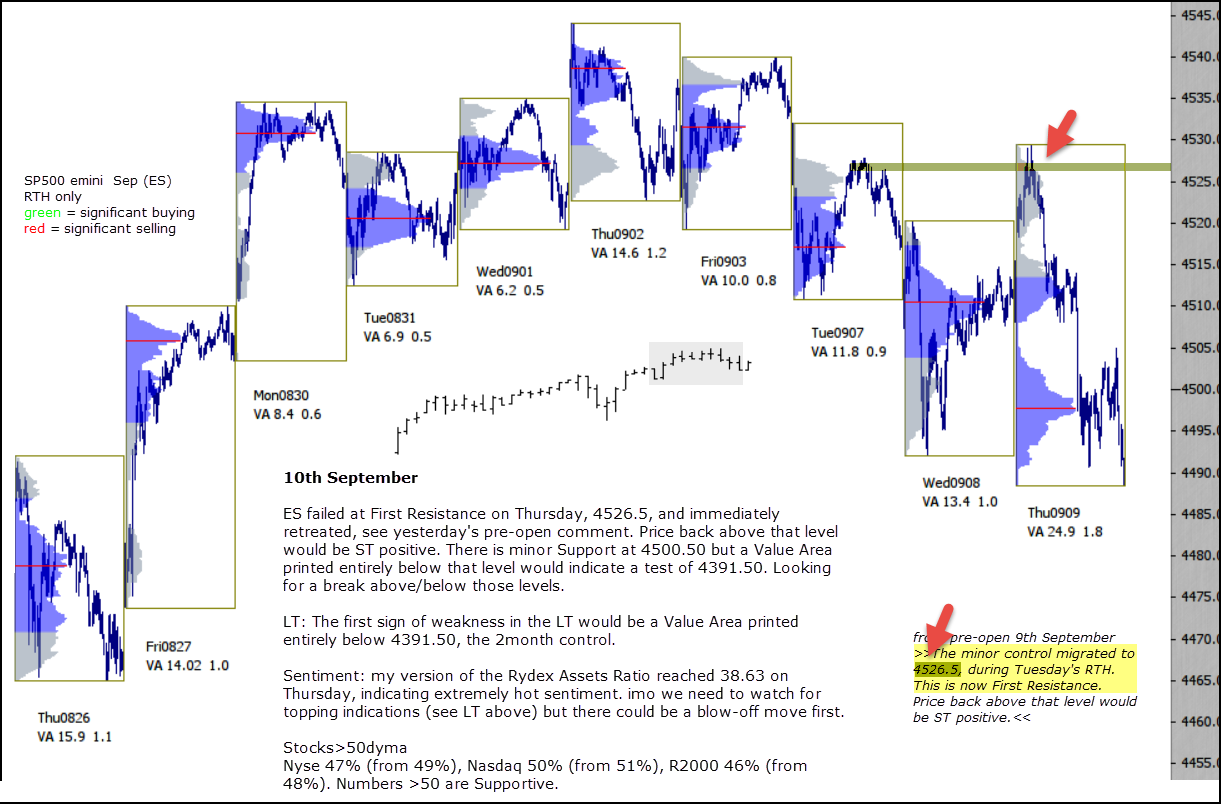
ES failed at First Resistance on Thursday, 4526.5, and immediately retreated, see yesterday’s pre-open comment. Price back above that level would be ST positive. There is minor Support at 4500.50 but a Value Area printed entirely below that level would indicate a test of 4391.50. Looking for a break above/below those levels.
LT: The first sign of weakness in the LT would be a Value Area printed entirely below 4391.50, the 2month control.
Sentiment: my version of the Rydex Assets Ratio reached 38.63 on Thursday, the highest ratio ever, indicating extremely hot sentiment. imo we need to watch for topping indications (see LT above) but there could be a blow-off move first.
Stocks>50dyma
Nyse 47% (from 49%), Nasdaq 50% (from 51%), R2000 46% (from 48%). Numbers >50 are Supportive.