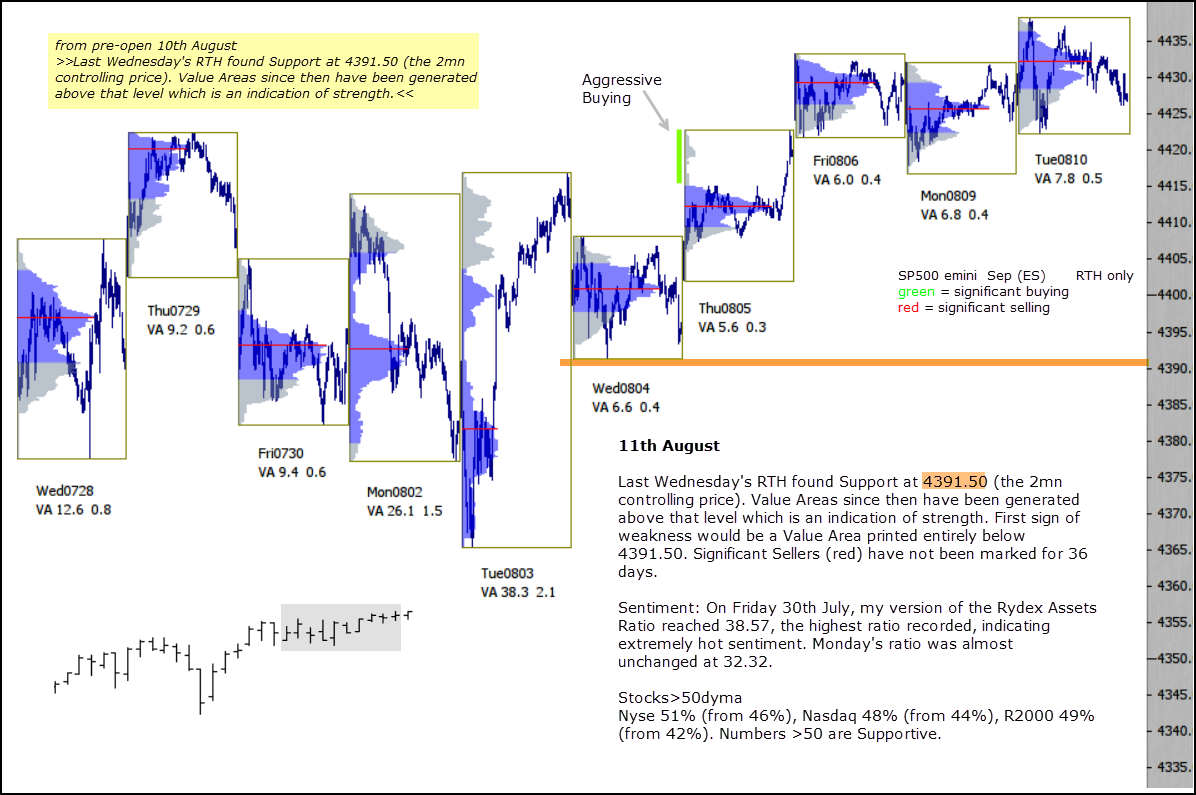
Last Wednesday’s RTH found Support at 4391.50 (the 2mn controlling price). Value Areas since then have been generated above that level which is an indication of strength. First sign of weakness would be a Value Area printed entirely below 4391.50. Significant Sellers (red) have not been marked for 36 days.
Sentiment: On Friday 30th July, my version of the Rydex Assets Ratio reached 38.57, the highest ratio recorded, indicating extremely hot sentiment. Monday’s ratio was almost unchanged at 32.32.
Stocks>50dyma
Nyse 51% (from 46%), Nasdaq 48% (from 44%), R2000 49% (from 42%). Numbers >50 are Supportive.