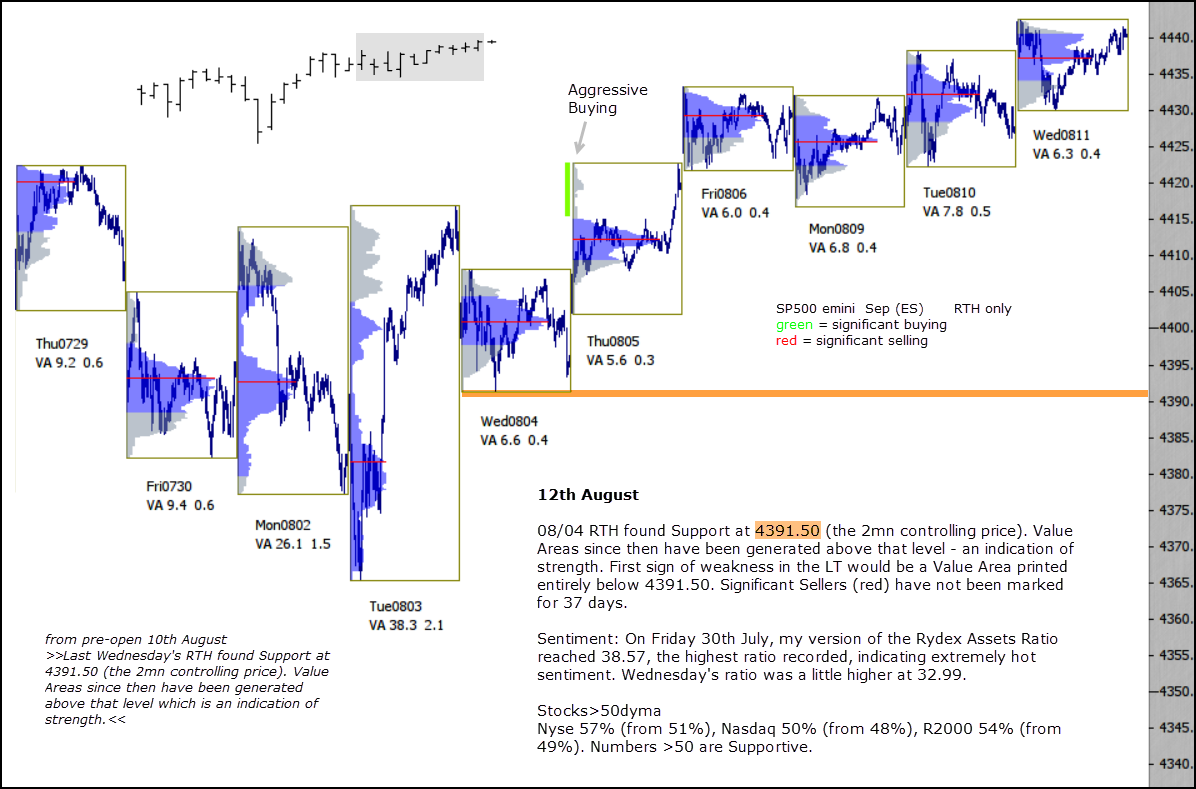
08/04 RTH found Support at 4391.50 (the 2mn controlling price). Value Areas since then have been generated above that level – an indication of strength. First sign of weakness in the LT would be a Value Area printed entirely below 4391.50. Significant Sellers (red) have not been marked for 37 days.
Sentiment: On Friday 30th July, my version of the Rydex Assets Ratio reached 38.57, the highest ratio recorded, indicating extremely hot sentiment. Wednesday’s ratio was a little higher at 32.99.
Stocks>50dyma
Nyse 57% (from 51%), Nasdaq 50% (from 48%), R2000 54% (from 49%). Numbers >50 are Supportive.