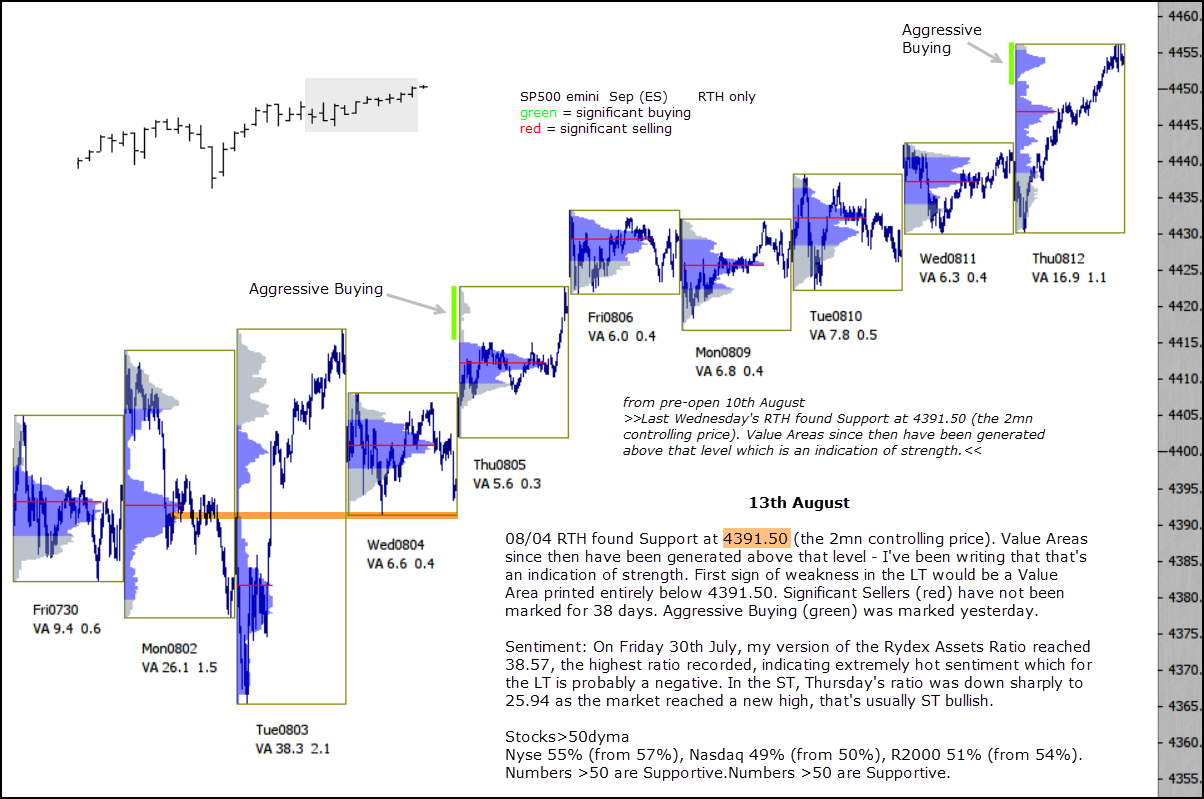
08/04 RTH found Support at 4391.50 (the 2mn controlling price). Value Areas since then have been generated above that level – I’ve been writing that that’s an indication of strength. First sign of weakness in the LT would be a Value Area printed entirely below 4391.50. Significant Sellers (red) have not been marked for 38 days. Aggressive Buying (green) was marked yesterday.
Sentiment: On Friday 30th July, my version of the Rydex Assets Ratio reached 38.57, the highest ratio recorded, indicating extremely hot sentiment which for the LT is probably a negative. In the ST, Thursday’s ratio was down sharply to 25.94 as the market reached a new high, that’s usually ST bullish.
Stocks>50dyma
Nyse 55% (from 57%), Nasdaq 49% (from 50%), R2000 51% (from 54%). Numbers >50 are Supportive.