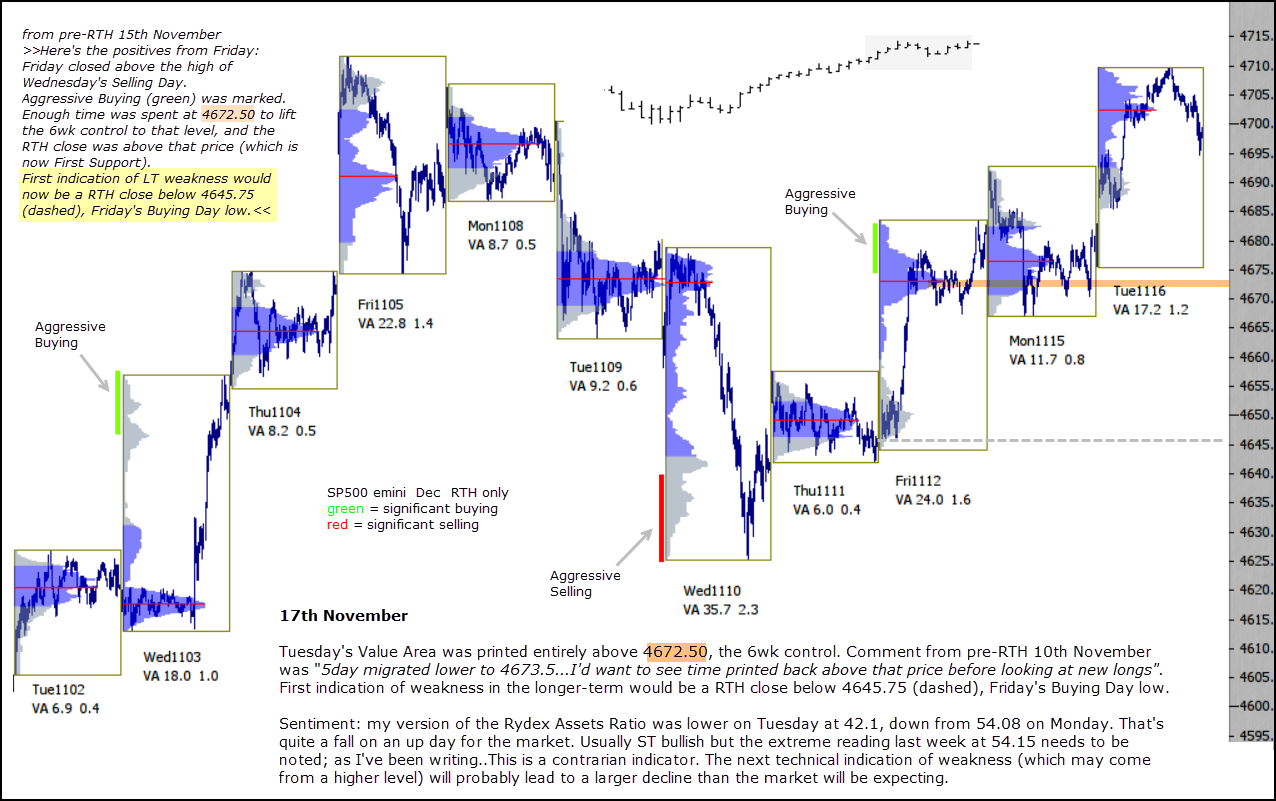
Tuesday’s Value Area was printed entirely above 4672.50, the 6wk control. Comment from pre-RTH 10th November
was “5day migrated lower to 4673.5…I’d want to see time printed back above that price before looking at new longs“. First indication of weakness in the longer-term would be a RTH close below 4645.75 (dashed on chart), Friday’s Buying Day low.
Sentiment: my version of the Rydex Assets Ratio was lower on Tuesday at 42.1, down from 54.08 on Monday. That’s quite a fall on an up day for the market. Usually ST bullish but the extreme reading last week at 54.15 needs to be noted; as I’ve been writing..This is a contrarian indicator. The next technical indication of weakness (which may come from a higher level) will probably lead to a larger decline than the market will be expecting.