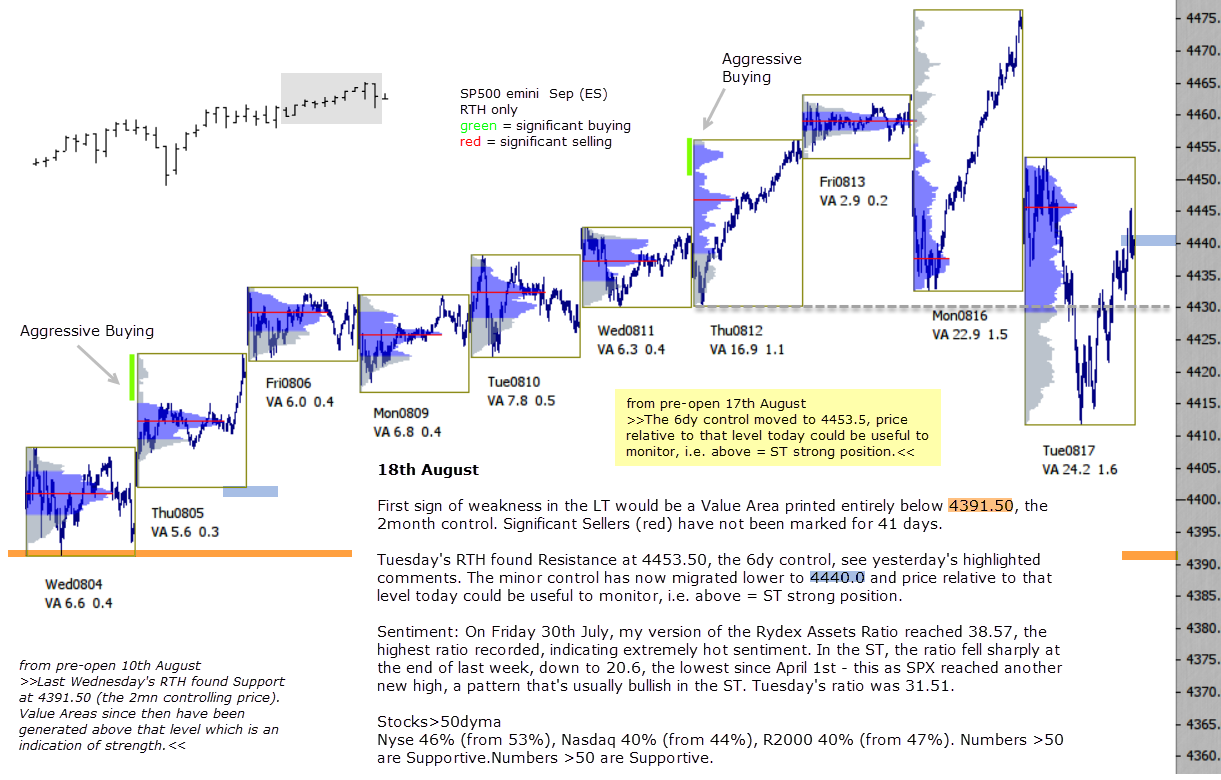
First sign of weakness in the LT would be a Value Area printed entirely below 4391.50, the 2month control. Significant Sellers (red) have not been marked for 41 days.
Tuesday’s RTH found Resistance at 4453.50, the 6dy control, see yesterday’s highlighted comments. The minor control has now migrated lower to 4440.0 and price relative to that level today could be useful to monitor, i.e. above = ST strong position.
Sentiment: On Friday 30th July, my version of the Rydex Assets Ratio reached 38.57, the highest ratio recorded, indicating extremely hot sentiment. In the ST, the ratio fell sharply at the end of last week, down to 20.6, the lowest since April 1st – this as SPX reached another new high, a pattern that’s usually bullish in the ST. Tuesday’s ratio was 31.51.
Stocks>50dyma
Nyse 46% (from 53%), Nasdaq 40% (from 44%), R2000 40% (from 47%). Numbers >50 are Supportive. Numbers >50 are Supportive.