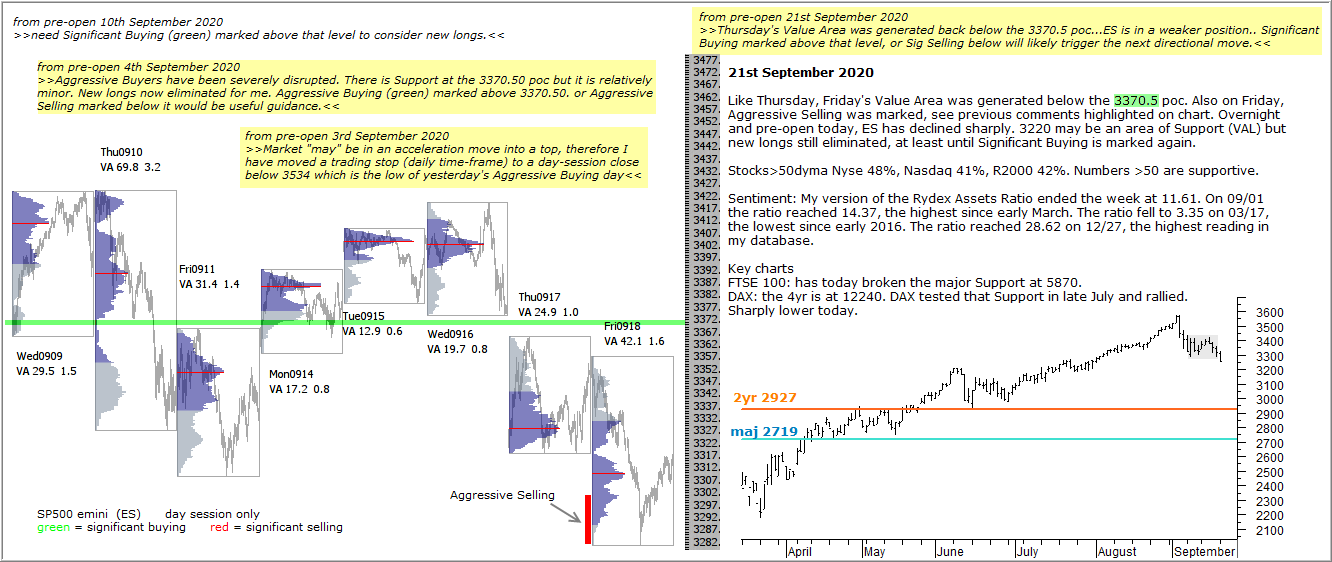
Like Thursday, Friday’s Value Area was generated below the 3370.5 poc. Also on Friday, Aggressive Selling was marked, see previous comments highlighted on chart. Overnight and pre-open today, ES has declined sharply. 3220 may be an area of Support (VAL) but new longs still eliminated, at least until Significant Buying is marked again.
Stocks>50dyma Nyse 48%, Nasdaq 41%, R2000 42%. Numbers >50 are supportive.
Sentiment: My version of the Rydex Assets Ratio ended the week at 11.61. On 09/01 the ratio reached 14.37, the highest since early March. The ratio fell to 3.35 on 03/17, the lowest since early 2016. The ratio reached 28.62 on 12/27, the highest reading in my database.
Key charts
FTSE 100: has today broken the major Support at 5870.
DAX: the 4yr is at 12240. DAX tested that Support in late July and rallied. Sharply lower today.