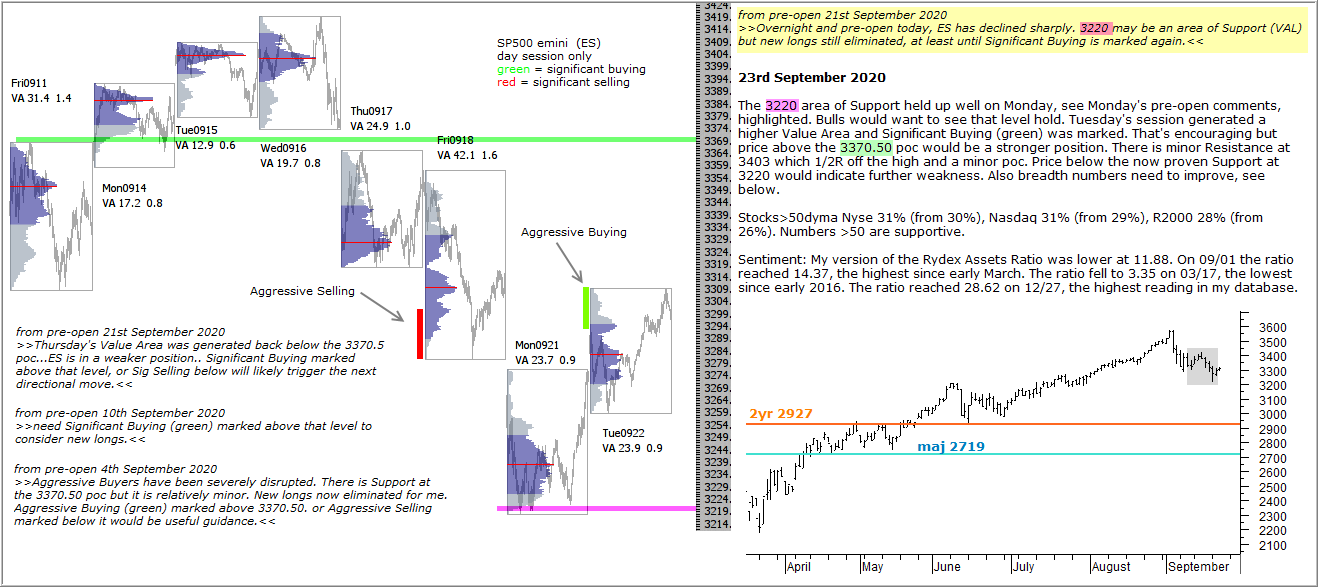
The 3220 area of Support held up well on Monday, see Monday’s pre-open comments, highlighted. Bulls would want to see that level hold. Tuesday’s session generated a higher Value Area and Significant Buying (green) was marked. That’s encouraging but price above the 3370.50 poc would be a stronger position. There is minor Resistance at 3403 which 1/2R off the high and a minor poc. Price below the now proven Support at 3220 would indicate further weakness. Also breadth numbers need to improve, see below.
Stocks>50dyma Nyse 31% (from 30%), Nasdaq 31% (from 29%), R2000 28% (from 26%). Numbers >50 are supportive.
Sentiment: My version of the Rydex Assets Ratio was lower at 11.88. On 09/01 the ratio reached 14.37, the highest since early March. The ratio fell to 3.35 on 03/17, the lowest since early 2016. The ratio reached 28.62 on 12/27, the highest reading in my database.
Key charts
FTSE 100: broke major Support at 5870 on Monday but has recovered that level, which is encouraging.
DAX: the 4yr is at 12240. DAX tested that Support in late July and rallied.