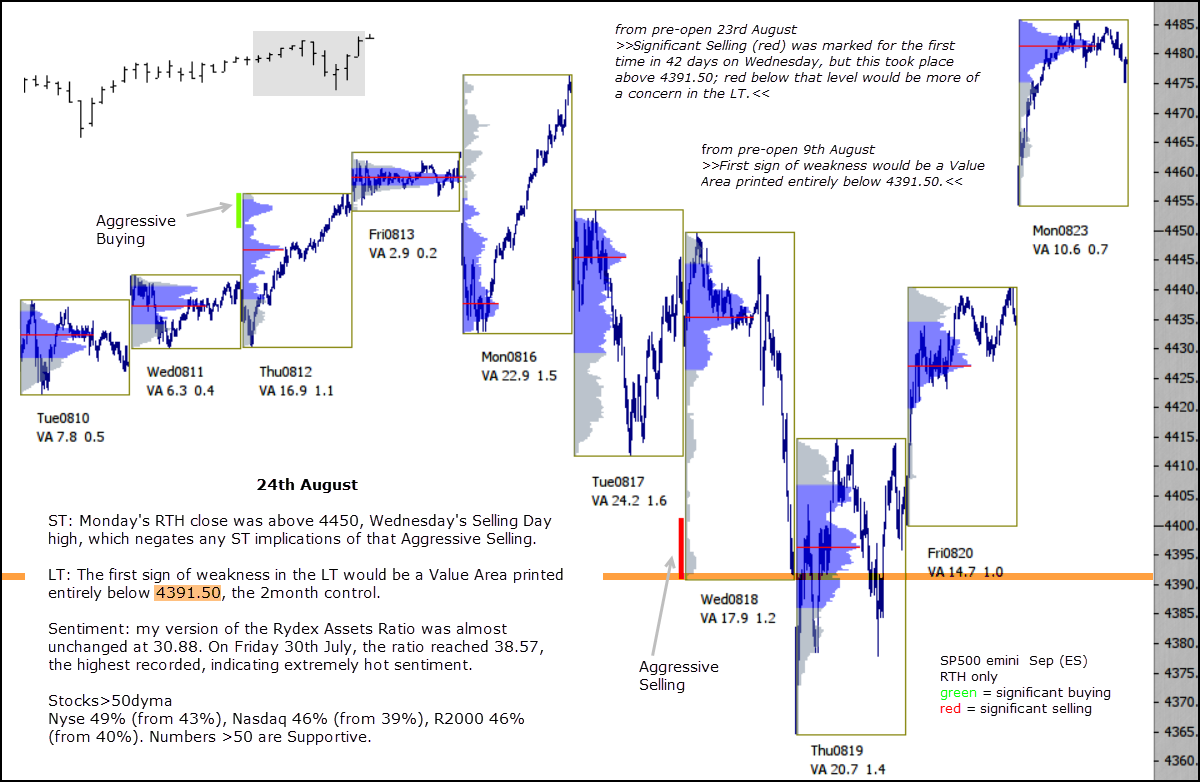
ST: Monday’s RTH close was above 4450, Wednesday’s Selling Day high, which negates any ST implications of that Aggressive Selling.
LT: The first sign of weakness in the LT would be a Value Area printed entirely below 4391.50, the 2month control.
Sentiment: my version of the Rydex Assets Ratio was almost unchanged at 30.88. On Friday 30th July, the ratio reached 38.57, the highest recorded, indicating extremely hot sentiment.
Stocks>50dyma
Nyse 49% (from 43%), Nasdaq 46% (from 39%), R2000 46% (from 40%). Numbers >50 are Supportive.