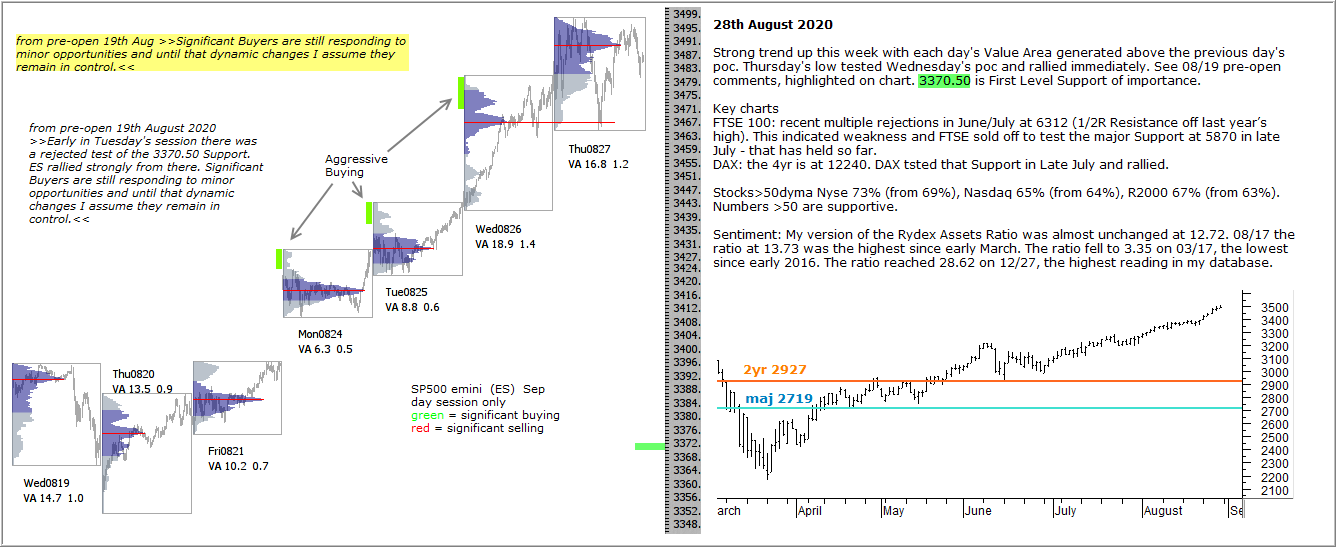
Strong trend up this week with each day’s Value Area generated above the previous day’s poc. Thursday’s low tested Wednesday’s poc and rallied immediately. See 08/19 pre-open comments, highlighted on chart. 3370.50 is First Level Support of importance.
Key charts
FTSE 100: recent multiple rejections in June/July at 6312 (1/2R Resistance off last year’s high). This indicated weakness and FTSE sold off to test the major Support at 5870 in late July – that has held so far.
DAX: the 4yr is at 12240. DAX tsted that Support in Late July and rallied.
Stocks>50dyma Nyse 73% (from 69%), Nasdaq 65% (from 64%), R2000 67% (from 63%). Numbers >50 are supportive.
Sentiment: My version of the Rydex Assets Ratio was almost unchanged at 12.72. 08/17 the ratio at 13.73 was the highest since early March. The ratio fell to 3.35 on 03/17, the lowest since early 2016. The ratio reached 28.62 on 12/27, the highest reading in my database.