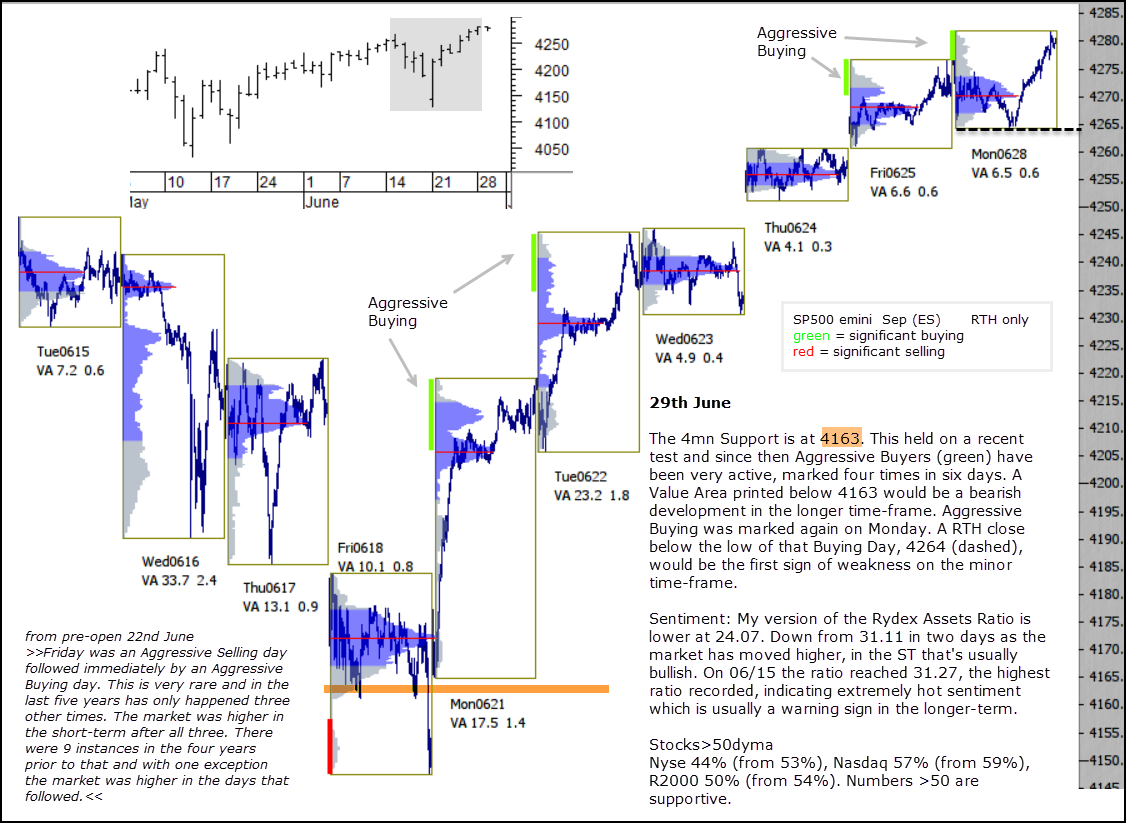
The 4mn Support is at 4163. This held on a recent test and since then Aggressive Buyers (green) have been very active, marked four times in six days. A Value Area printed below 4163 would be a bearish development in the longer time-frame.
Aggressive Buying was marked again on Monday. A RTH close below the low of that Buying Day, 4264 (dashed), would be the first sign of weakness on the minor time-frame.
Sentiment: My version of the Rydex Assets Ratio is lower at 24.07. Down from 31.11 in two days as the market has moved higher, in the ST that’s usually bullish. On 06/15 the ratio reached 31.27, the highest ratio recorded, indicating extremely hot sentiment which is usually a warning sign in the longer-term.
Stocks>50dyma
Nyse 44% (from 53%), Nasdaq 57% (from 59%), R2000 50% (from 54%). Numbers >50 are supportive.