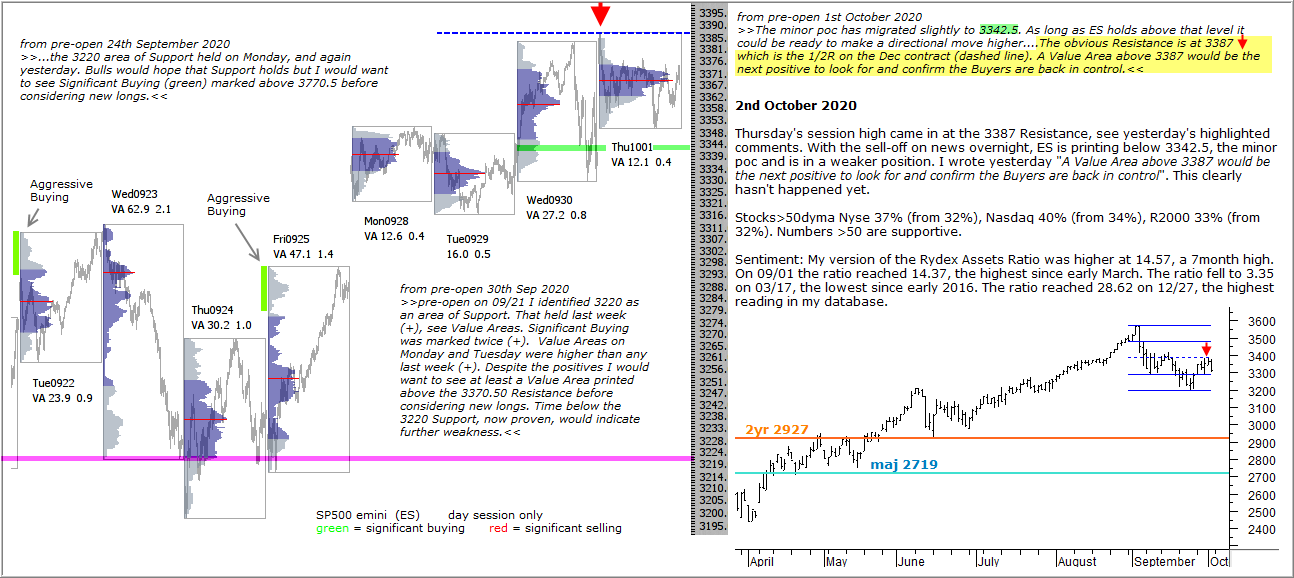
Thursday’s session high came in at the 3387 Resistance, see yesterday’s highlighted comments. With the sell-off on news overnight, ES is printing below 3342.5, the minor poc and is in a weaker position. I wrote yesterday “A Value Area above 3387 would be the next positive to look for and confirm the Buyers are back in control”. This clearly hasn’t happened yet.
Stocks>50dyma Nyse 37% (from 32%), Nasdaq 40% (from 34%), R2000 33% (from 32%). Numbers >50 are supportive.
Sentiment: My version of the Rydex Assets Ratio was higher at 14.57, a 7month high. On 09/01 the ratio reached 14.37, the highest since early March. The ratio fell to 3.35 on 03/17, the lowest since early 2016. The ratio reached 28.62 on 12/27, the highest reading in my database.