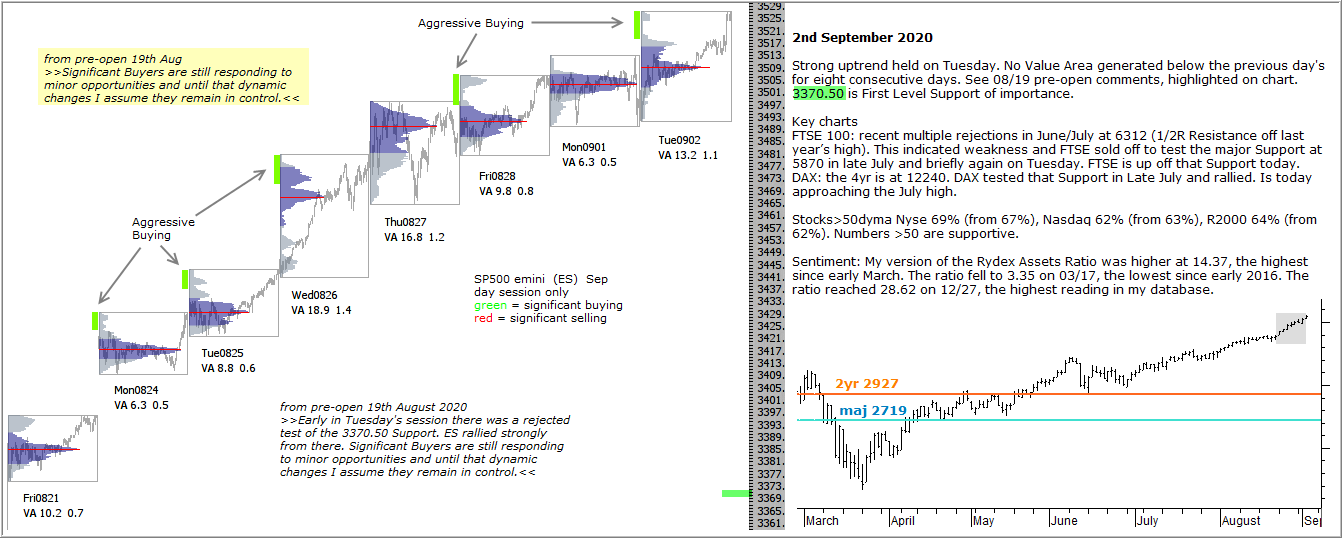
Strong uptrend held on Tuesday. No Value Area generated below the previous day’s for eight consecutive days. See 08/19 pre-open comments, highlighted on chart. 3370.50 is First Level Support of importance.
Key charts
FTSE 100: recent multiple rejections in June/July at 6312 (1/2R Resistance off last year’s high). This indicated weakness and FTSE sold off to test the major Support at 5870 in late July and briefly again on Tuesday. FTSE is up off that Support today.
DAX: the 4yr is at 12240. DAX tested that Support in Late July and rallied. Is today approaching the July high.
Stocks>50dyma Nyse 69% (from 67%), Nasdaq 62% (from 63%), R2000 64% (from 62%). Numbers >50 are supportive.
Sentiment: My version of the Rydex Assets Ratio was higher at 14.37, the highest since early March. The ratio fell to 3.35 on 03/17, the lowest since early 2016. The ratio reached 28.62 on 12/27, the highest reading in my database.