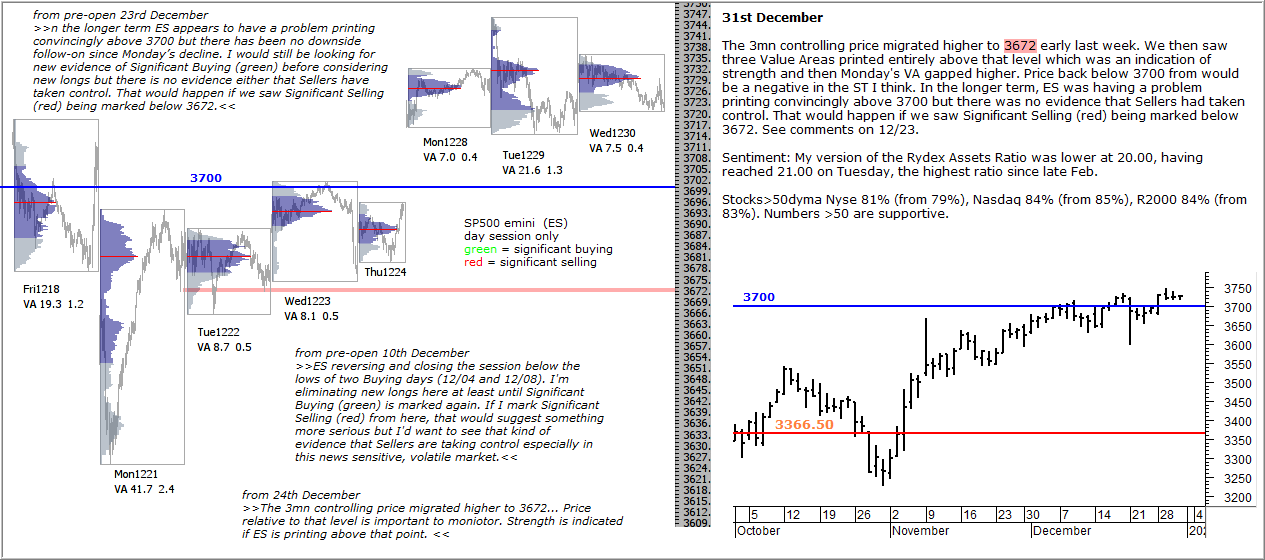
The 3mn controlling price migrated higher to 3672 early last week. We then saw three Value Areas printed entirely above that level which was an indication of strength and then Monday’s VA gapped higher. Price back below 3700 from would be a negative in the ST I think. In the longer term, ES was having a problem printing convincingly above 3700 but there was no evidence that Sellers had taken control. That would happen if we saw Significant Selling (red) being marked below 3672. See comments on 12/23.
Sentiment: My version of the Rydex Assets Ratio was lower at 20.00, having reached 21.00 on Tuesday, the highest ratio since late Feb.
Stocks>50dyma Nyse 81% (from 79%), Nasdaq 84% (from 85%), R2000 84% (from 83%). Numbers >50 are supportive.