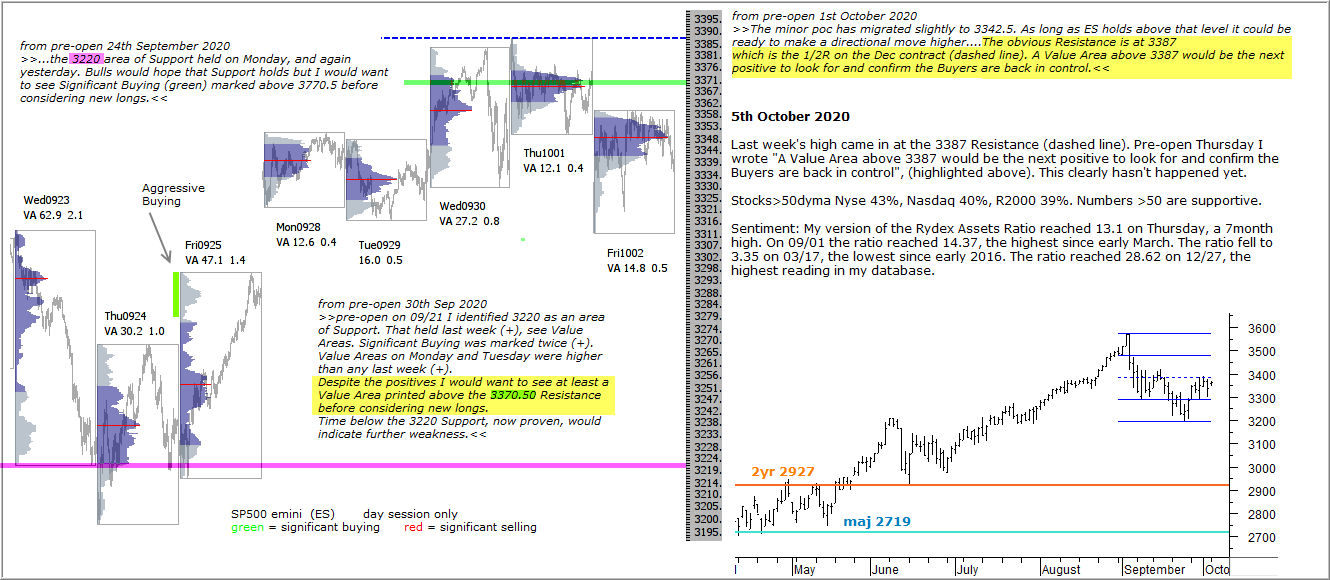
Last week’s high came in at the 3387 Resistance (dashed line). Pre-open Thursday I wrote “A Value Area above 3387 would be the next positive to look for and confirm the Buyers are back in control”, (highlighted above). This clearly hasn’t happened yet.
Stocks>50dyma Nyse 43%, Nasdaq 40%, R2000 39%. Numbers >50 are supportive.
Sentiment: My version of the Rydex Assets Ratio reached 13.1 on Thursday, a 7month high. On 09/01 the ratio reached 14.37, the highest since early March. The ratio fell to 3.35 on 03/17, the lowest since early 2016. The ratio reached 28.62 on 12/27, the highest reading in my database.