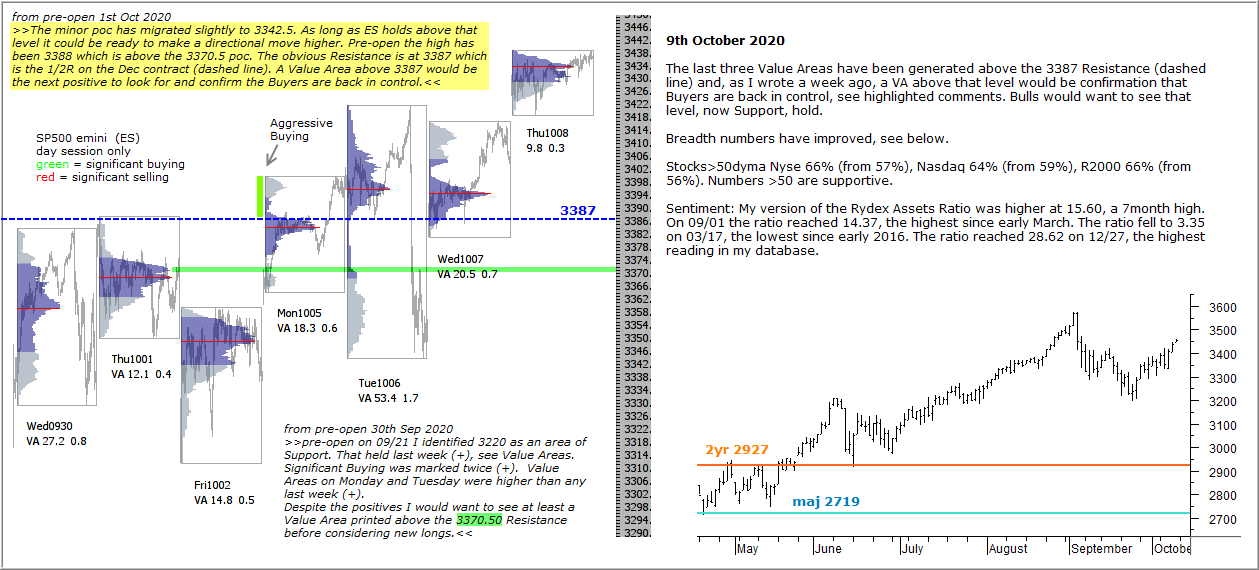
The last three Value Areas have been generated above the 3387 Resistance (dashed line) and, as I wrote a week ago, a VA above that level would be confirmation that Buyers are back in control, see highlighted comments. Bulls would want to see that level, now Support, hold.
Breadth numbers have improved again, see below.
Stocks>50dyma Nyse 66% (from 57%), Nasdaq 64% (from 59%), R2000 66% (from 56%). Numbers >50 are supportive.
Sentiment: My version of the Rydex Assets Ratio was higher at 15.60, a 7month high. On 09/01 the ratio reached 14.37, the highest since early March. The ratio fell to 3.35 on 03/17, the lowest since early 2016. The ratio reached 28.62 on 12/27, the highest reading in my database.