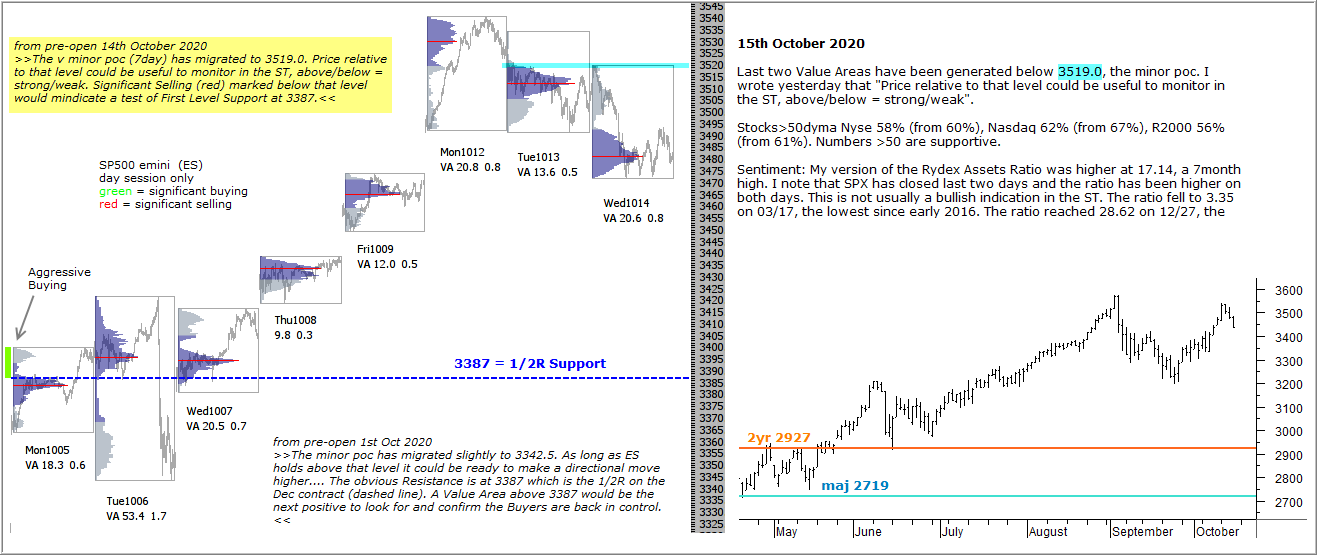
Last two Value Areas have been generated below 3519.0, the minor poc. I wrote yesterday that “Price relative to that level could be useful to monitor in the ST, above/below = strong/weak”.
Stocks>50dyma Nyse 58% (from 60%), Nasdaq 62% (from 67%), R2000 56% (from 61%). Numbers >50 are supportive.
Sentiment: My version of the Rydex Assets Ratio was higher at 17.14, a 7month high. I note that SPX has closed last two days and the ratio has been higher on both days. This is not usually a bullish indication in the ST. The ratio fell to 3.35 on 03/17, the lowest since early 2016. The ratio reached 28.62 on 12/27, the highest reading in my database.