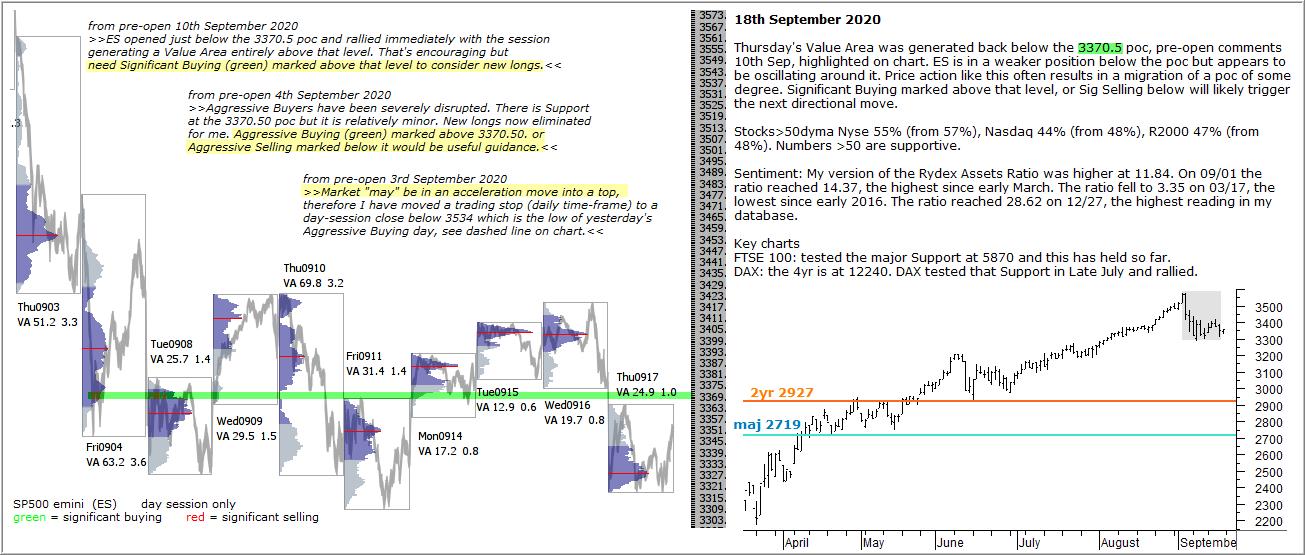
Thursday’s Value Area was generated back below the 3370.5 poc, see pre-open comments 10th Sep, highlighted on chart. ES is in a weaker position below the poc but appears to be oscillating around it. Price action like this often results in a migration of a poc of some degree. Significant Buying marked above that level, or Sig Selling below will likely trigger the next directional move.
Stocks>50dyma Nyse 55% (from 57%), Nasdaq 44% (from 48%), R2000 47% (from 48%). Numbers >50 are supportive.
Sentiment: My version of the Rydex Assets Ratio was higher at 11.84. On 09/01 the ratio reached 14.37, the highest since early March. The ratio fell to 3.35 on 03/17, the lowest since early 2016. The ratio reached 28.62 on 12/27, the highest reading in my database.
Key charts
FTSE 100: tested the major Support at 5870 and this has held so far.
DAX: the 4yr is at 12240. DAX tested that Support in Late July and rallied.