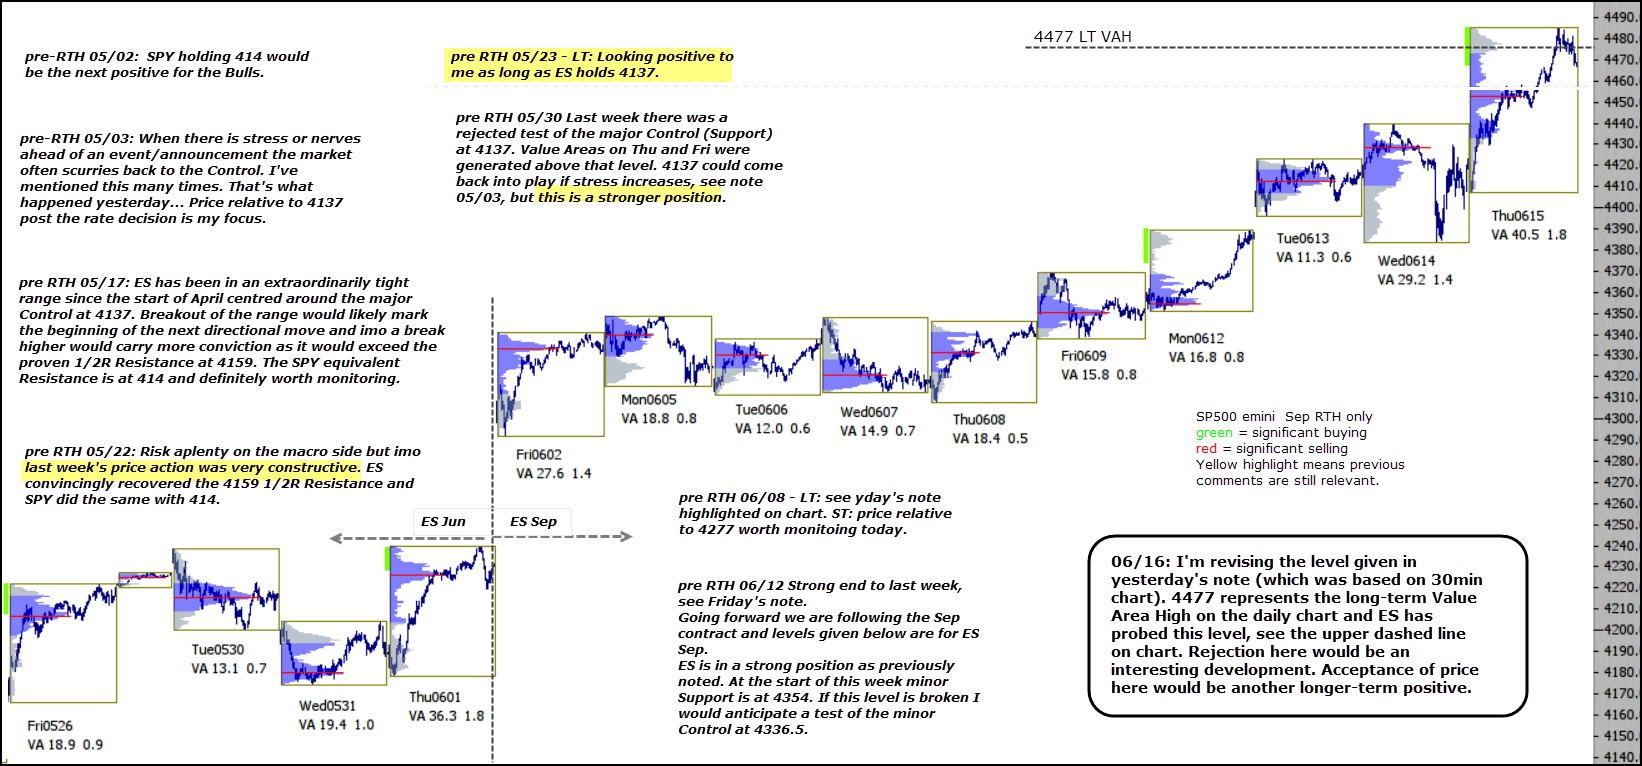
I’m revising the level given in yesterday’s note (which was based on 30min chart). 4477 represents the long-term Value Area High on the daily chart and ES has probed this level, see the upper dashed line on chart. Rejection here would be an interesting development. Acceptance of price here would be another longer-term positive.