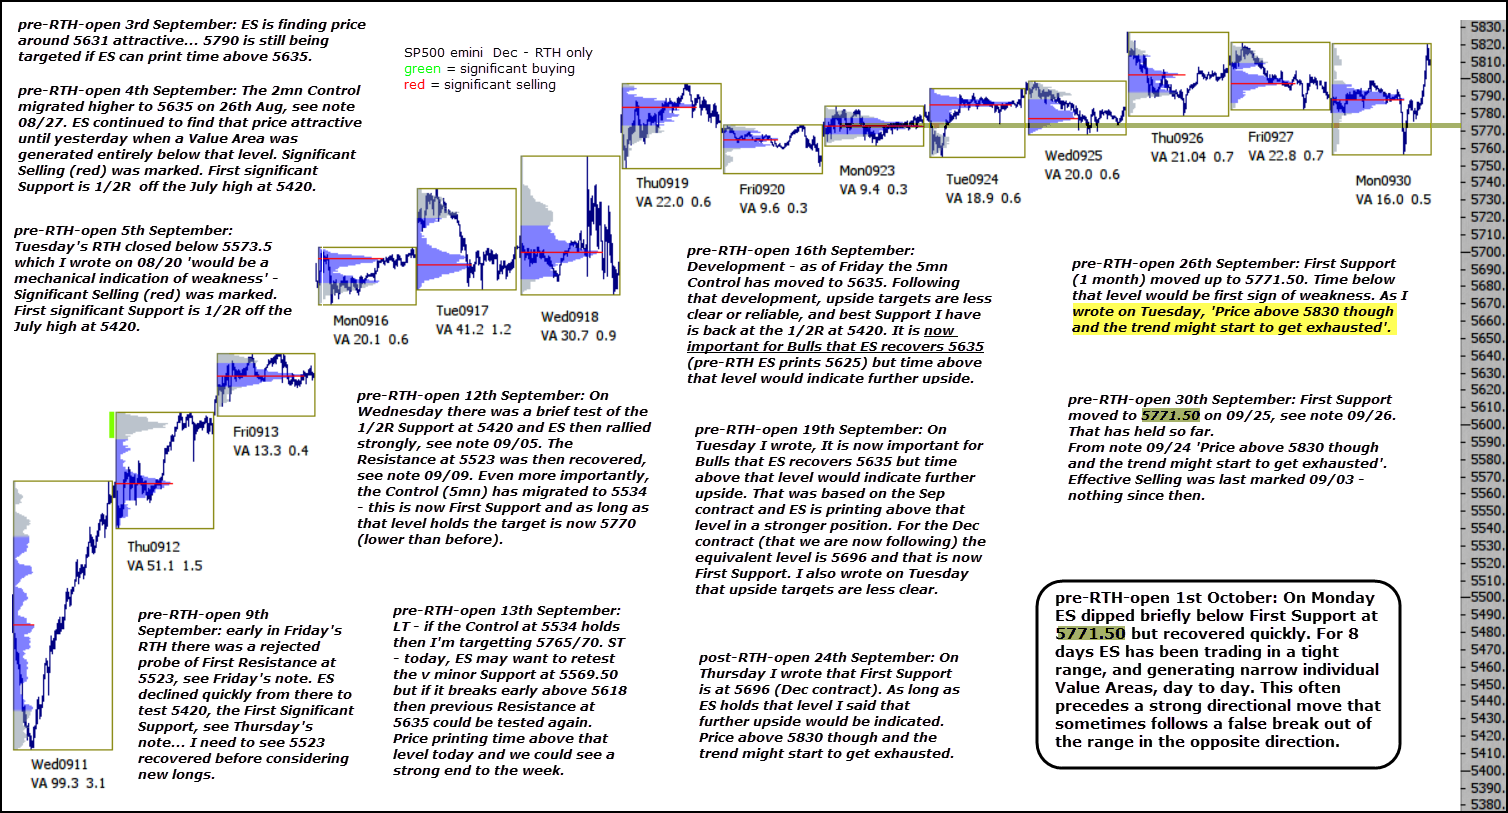
On Monday ES dipped briefly below First Support at 5771.50 but recovered quickly.
For 8 days ES has been trading in a tight range, and generating narrow individual Value Areas, day to day. This often precedes a strong directional move that sometimes follows a false break out of the range in the opposite direction.