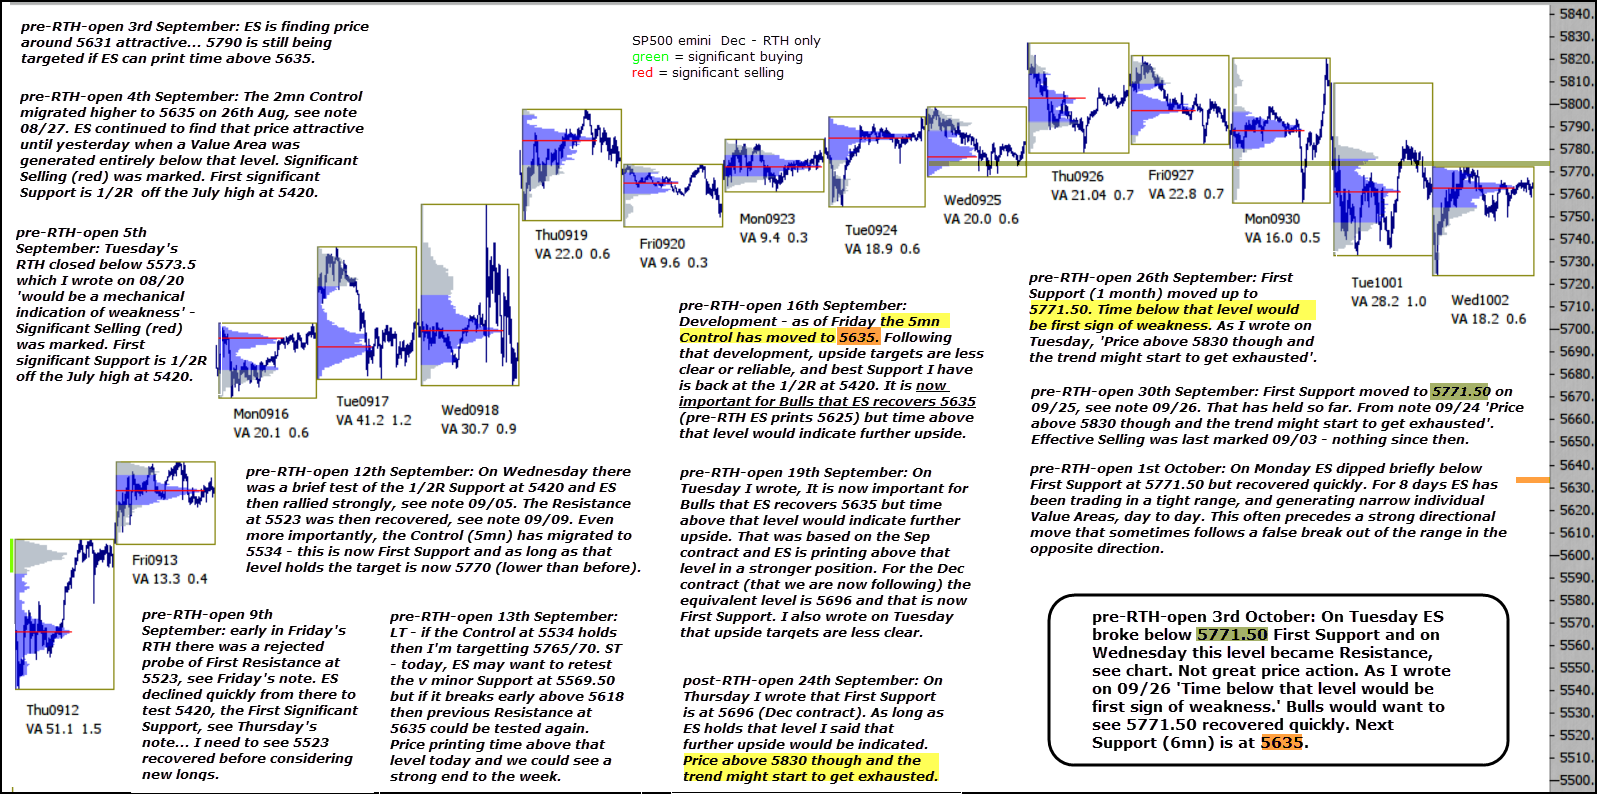
On Tuesday ES broke below 5771.50 First Support and on Wednesday this level became Resistance, see chart. Not great price action. As I wrote on 09/26 ‘Time below that level would be first sign of weakness.’ Bulls would want to see 5771.50 recovered quickly. Next Support (6mn) is at 5635.