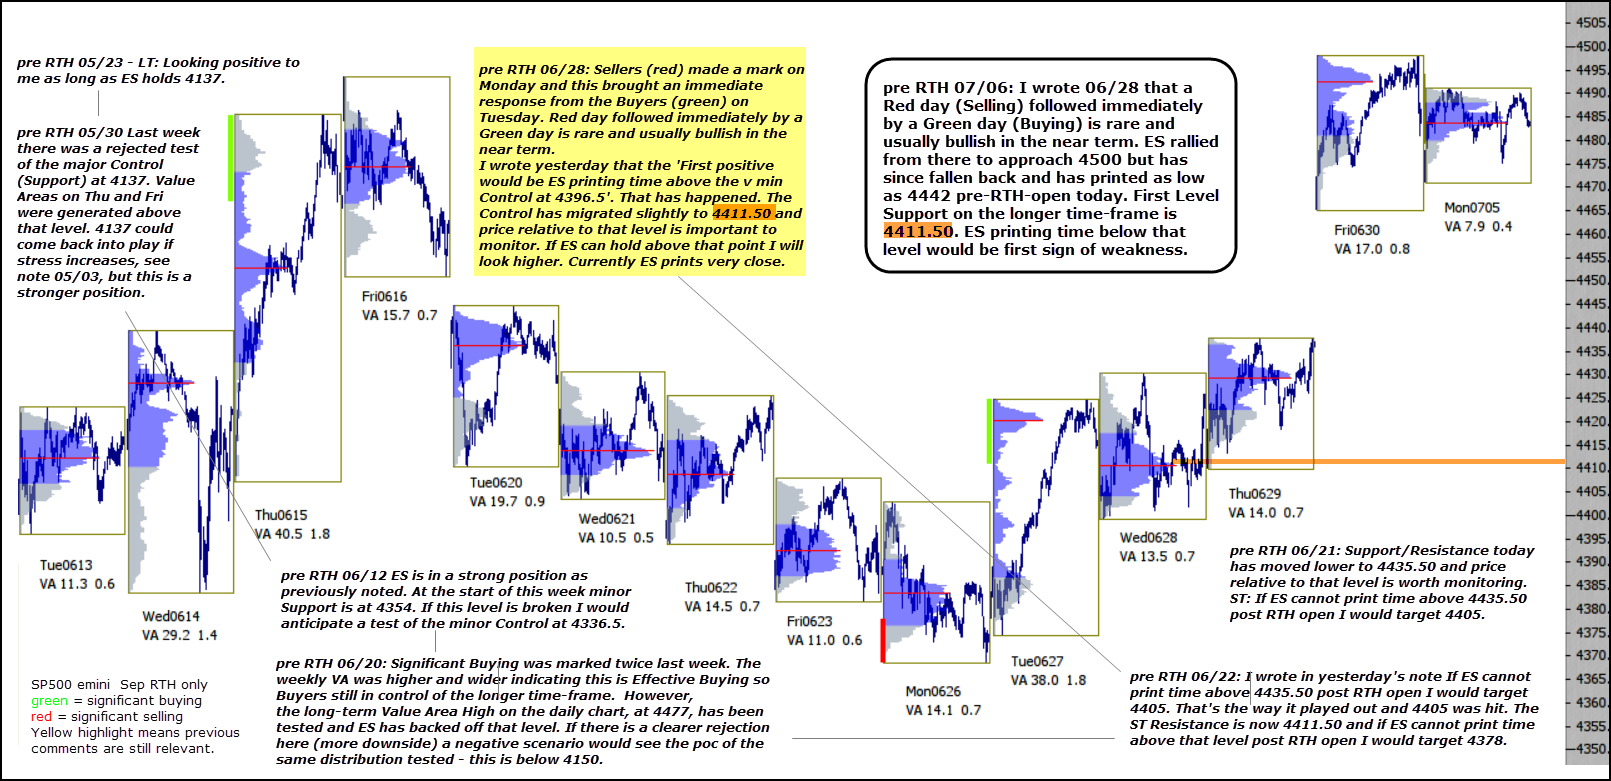
I wrote 06/28 that a Red day (Selling) followed immediately by a Green day (Buying) is rare and usually bullish in the near term. ES rallied from there to approach 4500 but has since fallen back and has printed as low as 4442 pre-RTH-open today. First Level Support on the longer time-frame is 4411.50. ES printing time below that level would be first sign of weakness.