FTSE found Support at 7037, the 18mn controlling price, in late Feb and this week probed 7223.30, the 1/2R Resistance once again. Price above this level would be a strong position.
Daily analysis - Stock Market, Bonds, Forex and more
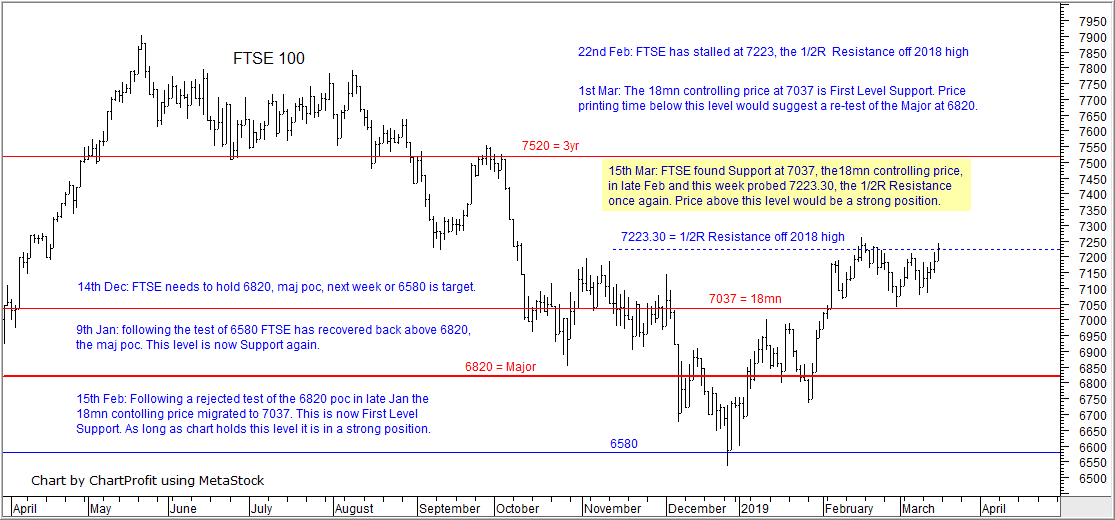
FTSE found Support at 7037, the 18mn controlling price, in late Feb and this week probed 7223.30, the 1/2R Resistance once again. Price above this level would be a strong position.