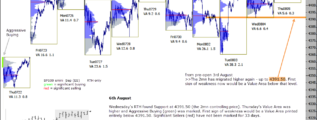
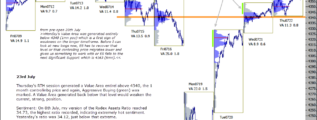
ChartProfit Chart Book - week ending 4th September 2020 … [Continue reading]
emini SP500 4th September 2020
See yesterday's pre-open comments, highlighted on chart. I wrote >>Market "may" be in an acceleration move into a top, therefore I have moved a trading stop (daily time-frame) to a day-session close below 3534 which is the low of yesterday's … [Continue reading]
Pulse Chart Update
In the pre-open report today I wrote that a trading stop (daily time-frame) was now in place which is a day-session close below 3534, the low of yesterday's Aggressive Buying day. See Green bars on Pulse Chart below which represent Aggressive Buying … [Continue reading]
emini S&P 500 3rd September 2020
Strong uptrend has held this week. No Value Area generated entirely below the previous day's controlling price for nine consecutive days. See 08/19 pre-open comments, highlighted on chart. I have marked Aggressive Buying on six of the last eight days … [Continue reading]
emini SP500 2nd September 2020
Strong uptrend held on Tuesday. No Value Area generated below the previous day's for eight consecutive days. See 08/19 pre-open comments, highlighted on chart. 3370.50 is First Level Support of importance. Key chartsFTSE 100: recent multiple … [Continue reading]
emini SP500 1st September 2020
Strong trend up for seven days with no Value Area generated below the previous day's. See 08/19 pre-open comments, highlighted on chart. 3370.50 is First Level Support of importance. Key chartsFTSE 100: recent multiple rejections in June/July at … [Continue reading]
emini ES 31st August 2020
Strong trend up last week with Value Areas generated above the previous day's poc, monday through Thursday. Thursday's low tested Wednesday's poc and rallied immediately. See 08/19 pre-open comments, highlighted on chart. 3370.50 is First Level … [Continue reading]
ChartProfit Chart Book 28th August 2020
ChartProfit Chart Book - week ending 28th August 2020 … [Continue reading]
emini SP500 28th August 2020
Strong trend up this week with each day's Value Area generated above the previous day's poc. Thursday's low tested Wednesday's poc and rallied immediately. See 08/19 pre-open comments, highlighted on chart. 3370.50 is First Level Support of … [Continue reading]
SP500 emini 27th August 2020
See Monday's pre-open comments, highlighted on chart. Aggressive Buyers marked last three days - that's rare. 3370.50 is First Level Support. Key chartsFTSE 100: recent multiple rejections in June/July at 6312 (1/2R Resistance off last year’s … [Continue reading]
- « Previous Page
- 1
- …
- 98
- 99
- 100
- 101
- 102
- …
- 531
- Next Page »