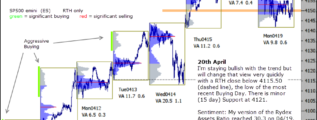
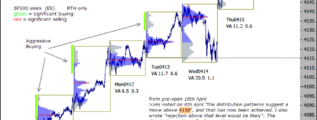
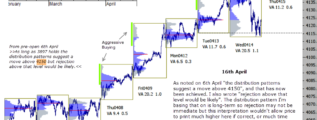
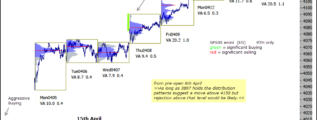
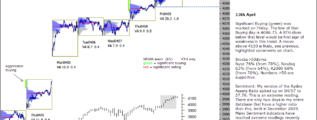
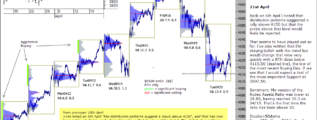
• Home

chartprofit.com

Daily analysis - Stock Market, Bonds, Forex and more

emini S&P 500 3rd September 2020

Posted on September 3, 2020 Written by Chart Prophet

Strong uptrend has held this week. No Value Area generated entirely below the previous day's controlling price for nine consecutive days. See 08/19 pre-open comments, highlighted on chart. I have marked Aggressive Buying on six of the last eight days … [Continue reading]

Filed Under: emini SP500 (ES)

emini SP500 2nd September 2020

Posted on September 2, 2020 Written by Chart Prophet

Strong uptrend held on Tuesday. No Value Area generated below the previous day's for eight consecutive days. See 08/19 pre-open comments, highlighted on chart. 3370.50 is First Level Support of importance. Key chartsFTSE 100: recent multiple … [Continue reading]

Filed Under: emini SP500 (ES)

emini SP500 1st September 2020

Posted on September 1, 2020 Written by Chart Prophet

Strong trend up for seven days with no Value Area generated below the previous day's. See 08/19 pre-open comments, highlighted on chart. 3370.50 is First Level Support of importance. Key chartsFTSE 100: recent multiple rejections in June/July at … [Continue reading]

Filed Under: emini SP500 (ES)

emini ES 31st August 2020

Posted on August 31, 2020 Written by Chart Prophet

Strong trend up last week with Value Areas generated above the previous day's poc, monday through Thursday. Thursday's low tested Wednesday's poc and rallied immediately. See 08/19 pre-open comments, highlighted on chart. 3370.50 is First Level … [Continue reading]

Filed Under: emini SP500 (ES)

ChartProfit Chart Book 28th August 2020

Posted on August 30, 2020 Written by Chart Prophet

ChartProfit Chart Book - week ending 28th August 2020 … [Continue reading]

Filed Under: emini SP500 (ES)

emini SP500 28th August 2020

Posted on August 28, 2020 Written by Chart Prophet

Strong trend up this week with each day's Value Area generated above the previous day's poc. Thursday's low tested Wednesday's poc and rallied immediately. See 08/19 pre-open comments, highlighted on chart. 3370.50 is First Level Support of … [Continue reading]

Filed Under: emini SP500 (ES)

SP500 emini 27th August 2020

Posted on August 27, 2020 Written by Chart Prophet

See Monday's pre-open comments, highlighted on chart. Aggressive Buyers marked last three days - that's rare. 3370.50 is First Level Support. Key chartsFTSE 100: recent multiple rejections in June/July at 6312 (1/2R Resistance off last year’s … [Continue reading]

Filed Under: emini SP500 (ES)

emini 26th August 2020

Posted on August 26, 2020 Written by Chart Prophet

See Monday's pre-open comments, highlighted on chart. Aggressive Buyers marked on Monday and Tuesday. 3370.50 is First Level Support. Key chartsFTSE 100: recent multiple rejections in June/July at 6312 (1/2R Resistance off last year’s high). This … [Continue reading]

Filed Under: emini SP500 (ES)

emini SP500 25th August 2020

Posted on August 25, 2020 Written by Chart Prophet

See yesterday's pre-open comments, highlighted on chart. Aggressive Buyers marked on Monday. 3370.50 is First Level Support. Key chartsFTSE 100: recent multiple rejections in June/July at 6312 (1/2R Resistance off last year’s high). This indicated … [Continue reading]

Filed Under: emini SP500 (ES)

emini SP500 24th August 2020

Posted on August 24, 2020 Written by Chart Prophet

from pre-open 19th Aug >>Significant Buyers are still responding to minor opportunities and until that dynamic changes I assume they remain in control.<< That remains the case. Last week there were three rejected tests of the 3370.50 … [Continue reading]

Filed Under: emini SP500 (ES)

  • « Previous Page
  • 1
  • …
  • 106
  • 107
  • 108
  • 109
  • 110
  • …
  • 538
  • Next Page »

Archives

Copyright © 2025 · Focus Pro Theme on Genesis Framework · WordPress · Log in