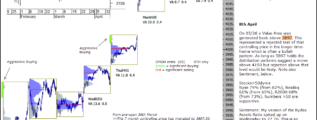
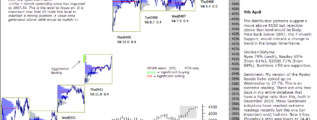
• Home

chartprofit.com

Daily analysis - Stock Market, Bonds, Forex and more

emini SP500 24th August 2020

Posted on August 24, 2020 Written by Chart Prophet

from pre-open 19th Aug >>Significant Buyers are still responding to minor opportunities and until that dynamic changes I assume they remain in control.<< That remains the case. Last week there were three rejected tests of the 3370.50 … [Continue reading]

Filed Under: emini SP500 (ES)

ChartProfit Chart Book 21st August 2020

Posted on August 23, 2020 Written by Chart Prophet

ChartProfit Chart Book - week ending 21st August 2020 … [Continue reading]

Filed Under: emini SP500 (ES)

SP500 emini 21st August 2020

Posted on August 21, 2020 Written by Chart Prophet

Pre-open today #ES is printing just below the 3370.50 Support. A Value Area printed below that level would be the first sign of weakness and increase the odds of a re-test of the Support at 3217.50 Key chartsFTSE 100: recent multiple rejections in … [Continue reading]

Filed Under: emini SP500 (ES)

SP500 emini 20th August 2020

Posted on August 20, 2020 Written by Chart Prophet

Early in Tuesday's session there was a rejected test of the 3370.50 Support, see yesterday's comments, and again late in Wednesday's session. Pre-open today ES is printing below that Support in a weaker position. If the location of today's Value Area … [Continue reading]

Filed Under: emini SP500 (ES)

emini SP500 19th August 2020

Posted on August 19, 2020 Written by Chart Prophet

Early in Tuesday's session there was a rejected test of the 3370.50 Support. ES rallied strongly from there. Significant Buyers are still responding to minor opportunities and until that dynamic changes I assume they remain in control. Key … [Continue reading]

Filed Under: emini SP500 (ES)

emini SP500 18th August 2020

Posted on August 18, 2020 Written by Chart Prophet

1 month Support/Resistance migrated to 3370.50. Price relative to that level is worth watching. Key chartsFTSE 100: recent multiple rejections in June/July at 6312 (1/2R Resistance off last year’s high). This indicated weakness and FTSE sold off … [Continue reading]

Filed Under: emini SP500 (ES)

emini SP500 17th August 2020

Posted on August 17, 2020 Written by Chart Prophet

1 month S/R has migrated to 3370.50. Price relative to that level is worth watching at the start of this week.S/R = Support/Resistance … [Continue reading]

Filed Under: emini SP500 (ES)

emini SP500 14th August 2020

Posted on August 14, 2020 Written by Chart Prophet

On Tuesday the minor Support migrated to ES 3317.50. Price printing time below this level would be first sign of minor weakness. … [Continue reading]

Filed Under: emini SP500 (ES)

emini SP500 12th August 2020

Posted on August 12, 2020 Written by Chart Prophet

the minor (13 day) Support has migrated to ES 3317.50. Price printing time below this level would be first sign of minor weakness. … [Continue reading]

Filed Under: emini SP500 (ES)

emini SP500 10th August

Posted on August 10, 2020 Written by Chart Prophet

from pre-open 5th August 2020 The 2month Support at 3217.50 was tested 07/30, and ES rallied strongly from there. Price printing time below that level would be first sign of weakness. In the dayframe, a v minor poc has emerged at 3289.50.This may … [Continue reading]

Filed Under: emini SP500 (ES)

  • « Previous Page
  • 1
  • …
  • 107
  • 108
  • 109
  • 110
  • 111
  • …
  • 539
  • Next Page »

Archives

Copyright © 2025 · Focus Pro Theme on Genesis Framework · WordPress · Log in