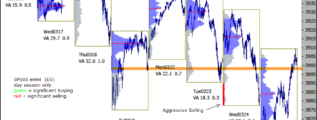
The 7 month controlling price has migrated to 3897.50. This is the level to focus on. It is important now that ES holds this level to maintain a strong location. A Value Area generated above 3898 would be bullish. … [Continue reading]
Daily analysis - Stock Market, Bonds, Forex and more
The 7 month controlling price has migrated to 3897.50. This is the level to focus on. It is important now that ES holds this level to maintain a strong location. A Value Area generated above 3898 would be bullish. … [Continue reading]
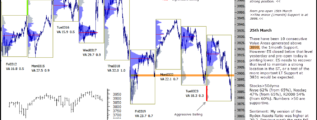
There have been 10 consecutive Value Areas generated above 3898, the 1month Support. However ES closed below that level yesterday and pre-open today is printing lower. ES needs to recover that level to maintain a strong location in the ST, or a test … [Continue reading]

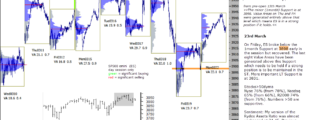
Late last week, ES tested the 1month Support at 3898 but recovered. This happened again in yesterday's session. Currently ES is printing back above 3900. The last nine Value Areas have been generated above this Support which needs to be held if a … [Continue reading]
On Friday, ES broke below the 1month Support at 3898 early in the session but recovered. The last eight Value Areas have been generated above this Support which needs to be held ifa strong position is to be maintained in the ST. More important LT … [Continue reading]
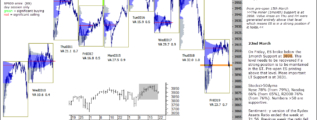
On Friday, ES broke below the 1month Support at 3898. This level needs to be recovered if a strong position is to be maintained in the ST. Pre-open ES printing above that level. More important LT Support is at 3831. Stocks>50dymaNyse 78% (from … [Continue reading]
ChartProfit Chart Book - week ending 19th March 2021 … [Continue reading]
Six Value Areas generated above the 1month Support at 3898. A strong position as long as ES holds that level. More important LT Support is at 3831. Stocks>50dymaNyse 79% (from 84%), Nasdaq 65% (from 73%, R2000 76% (from 82%). Numbers >50 are … [Continue reading]
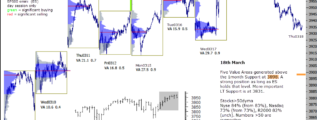
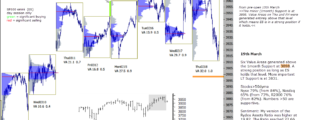
Five Value Areas generated above the 1month Support at 3898. A strong position as long as ES holds that level. More important LT Support is at 3831. Stocks>50dymaNyse 84% (from 83%), Nasdaq 73% (from 73%), R2000 82% (unch). Numbers >50 are … [Continue reading]
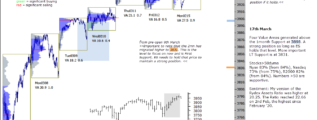
Four Value Areas generated above the 1month Support at 3898. A strong position as long as ES holds that level. More important LT Support is at 3831. Stocks>50dymaNyse 83% (from 84%), Nasdaq 73% (from 75%), R2000 82% (from 84%). Numbers >50 … [Continue reading]
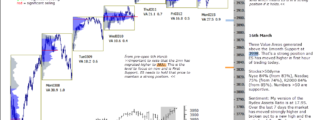
Three Value Areas generated above the 1month Support at 3998. That's a strong position and ES has moved higher in RTH today. Stocks>50dyma Nyse 84% (from 83%), Nasdaq 75% (from 74%), R2000 84% (from 85%). Numbers >50 are … [Continue reading]