• Home

chartprofit.com

Daily analysis - Stock Market, Bonds, Forex and more

SP500 emini 28th July

Posted on July 28, 2020 Written by Chart Prophet

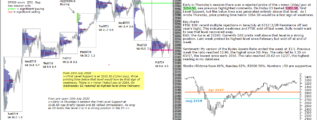
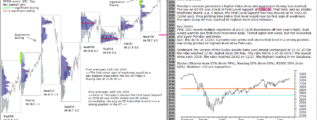
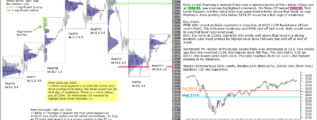
Early in last Thursday's session there was a rejected probe of the v minor (4day) poc at 3264.50, see previous highlighted comments. On Friday ES tested 3202.50, First Level Support, but the Value Area was generated entirely above that level, as was … [Continue reading]

Filed Under: emini SP500 (ES)

SP500 futures 27th July 2020

Posted on July 27, 2020 Written by Chart Prophet

Early in Thursday's session there was a rejected probe of the v minor (4day) poc at 3264.50, see previous highlighted comments. On Friday ES tested 3202.50, First Level Support, but the Value Area was generated entirely above that level. As I wrote … [Continue reading]

Filed Under: emini SP500 (ES)

ChartProfit Chart Book 24th July 2020

Posted on July 26, 2020 Written by Chart Prophet

ChartProfit Chart Book - week ending 24th July 2020 … [Continue reading]

Filed Under: emini SP500 (ES)

emini SP500 24th July 2020

Posted on July 24, 2020 Written by Chart Prophet

Early in Thursday's session there was a rejected probe of the v minor (4day) poc at 3264.50, see yesterday's highlighted comments. Pre-open today ES has briefly tested 3202.50, First Level Support. Price printing time below that level would be a … [Continue reading]

Filed Under: emini SP500 (ES)

emini ES 23rd July 2020

Posted on July 23, 2020 Written by Chart Prophet

On Monday Aggressive Buying was marked. First Level Support is at 3202.50 (12mn poc). Price printing time below that level would now be first sign of weakness. There is v minor (4day) Support at 3264. On Wednesday ES reached its highest level since … [Continue reading]

Filed Under: emini SP500 (ES)

SP500 futures report pre-open 22nd July

Posted on July 22, 2020 Written by Chart Prophet

On Monday Aggressive Buying was marked on the SP500 futures (ES). Tuesday's Value Area was higher. First Level Support is at 3202.50 (12mn poc). Price printing time below that level would now be first sign of weakness. On Tuesday ES reached its … [Continue reading]

Filed Under: emini SP500 (ES)

emini reaches highest level since February

Posted on July 21, 2020 Written by Chart Prophet

Monday's session generated a higher Value Area and Aggressive Buying was marked. The low on 07/09 was a test of First Level Support at 3106.50. That held, and on smaller timeframe charts, e.g. 5 minue, the First Level Support has now moved up to … [Continue reading]

Filed Under: emini SP500 (ES)

ES emini starts the week in strong position

Posted on July 20, 2020 Written by Chart Prophet

The low on 07/09 was a test of First Level Support at 3106.50. That has held. The first minor sign of weakness would be a day-session close below the low of the 07/10 Buying Day at 3126.50. As long as ES holds 3106.5 it is in a strong position in the … [Continue reading]

Filed Under: emini SP500 (ES)

EURUSD at Resistance

Posted on July 19, 2020 Written by Chart Prophet

EURUSD at Resistance

EURUSD: the 1/2R Resistance (off 2017 low) was again approached this week, see probe in March. Price printing time above this level would put EURUSD in a stronger position with next Resistance at the Value Area High at 1.1681 … [Continue reading]

Filed Under: EURUSD

GBPUSD ST strong position but LT bias is down

Posted on July 19, 2020 Written by Chart Prophet

GBPUSD

… [Continue reading]

Filed Under: GBPUSD

  • « Previous Page
  • 1
  • …
  • 109
  • 110
  • 111
  • 112
  • 113
  • …
  • 539
  • Next Page »

Archives

Copyright © 2025 · Focus Pro Theme on Genesis Framework · WordPress · Log in