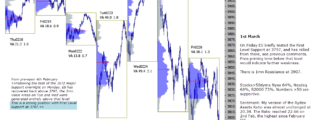
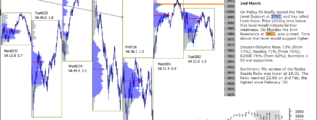
• Home

chartprofit.com

Daily analysis - Stock Market, Bonds, Forex and more

ChartProfit Chart Book 17th July 2020

Posted on July 18, 2020 Written by Chart Prophet

ChartProfit Chart Book - week ending 17th July 2020 … [Continue reading]

Filed Under: Stock Market sentiment

emini 17th July 2020

Posted on July 17, 2020 Written by Chart Prophet

The low last week was a test of First Level Support at 3106.50. That has held. The first minor sign of weakness would be a day-session close below the low of last Friday's Buying Day at 3126.50. As long as ES holds 3106.5 it is in a strong position … [Continue reading]

Filed Under: emini SP500 (ES)

emini 16th July 2020

Posted on July 16, 2020 Written by Chart Prophet

The low last week was a test of First Level Support at 3106.50. That has held. The first minor sign of weakness would be a day-session close below the low of Friday's Buying Day at 3126.50. As long as ES holds 3106.5 it is in a strong position in the … [Continue reading]

Filed Under: emini SP500 (ES)

emini 15th July 2020

Posted on July 15, 2020 Written by Chart Prophet

The low last week was a test of First Level Support at 3106.50 on Thursday. That has held. The first minor sign of weakness would be a day-session close below the low of Friday's Buying Day at 3126.50. As long as ES holds 3106.5 it is in a strong … [Continue reading]

Filed Under: emini SP500 (ES)

emini 14th July 2020

Posted on July 14, 2020 Written by Chart Prophet

The low last week was a test of First Level Support at 3106.50 on Thursday, see chart and previous comments. ES rallied immediately and generated a higher Value Area on Friday with Aggressive Buying (green-at-top) being marked. The first minor sign … [Continue reading]

Filed Under: emini SP500 (ES)

emini report at start of the week

Posted on July 13, 2020 Written by Chart Prophet

The low last week was a test of First Level Support at 3106.50 on Thursday, see chart and previous comments. ES rallied immediately and generated a higher Value Area on Friday with Aggressive Buying (green-at-top) being marked. As long as ES holds … [Continue reading]

Filed Under: emini SP500 (ES)

ChartProfit Chart Book 10th July 2020

Posted on July 12, 2020 Written by Chart Prophet

ChartProfit Chart Book - week ending 10th July 2020 … [Continue reading]

Filed Under: emini SP500 (ES)

emini holds support

Posted on July 10, 2020 Written by Chart Prophet

Early in Thursday's session the First Level Support at 3106.50 was briefly tested and ES rallied immediately, see previous highlighted comments. As long as ES holds that level it is in a strong position in the ST. Longer-term Support is at 2926, the … [Continue reading]

Filed Under: emini SP500 (ES)

emini SP500 remains in strong position

Posted on July 9, 2020 Written by Chart Prophet

Last four Value Areas have been generated above 3106.5, the 10mn poc. As long as ES holds that level it is in a strong position in the ST. Longer-term Support is at 2926, the 2yr. Key charts FTSE 100: recent multiple rejections at 6312 (1/2R … [Continue reading]

Filed Under: emini SP500 (ES)

emini 8th July 2020

Posted on July 8, 2020 Written by Chart Prophet

Last three Value Areas have been generated above 3106.5, the 10mn poc. As long as ES holds that level it is in a strong position in the ST. Longer-term Support is at 2926, the 2yr. Key charts FTSE 100: recent multiple rejections at 6312 (1/2R … [Continue reading]

Filed Under: emini SP500 (ES)

  • « Previous Page
  • 1
  • …
  • 110
  • 111
  • 112
  • 113
  • 114
  • …
  • 539
  • Next Page »

Archives

Copyright © 2025 · Focus Pro Theme on Genesis Framework · WordPress · Log in